Figure 6.

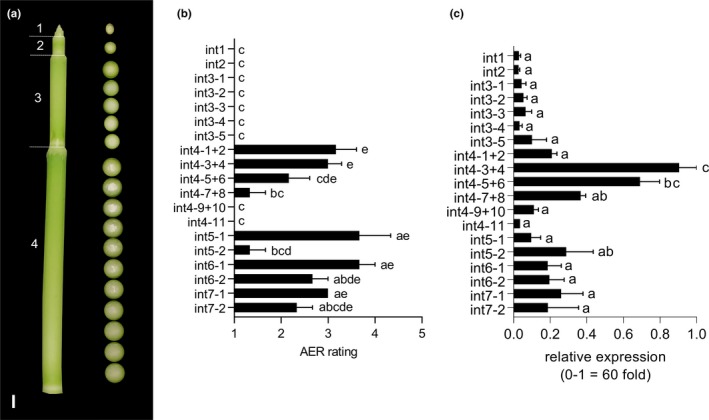
Aerenchyma (AER) formation and expression of SbNAC_D in stem sections of R07020. (a) Photograph of the top of a R07020 stem. Internode numbers are indicated to the left of the stem. R07020 remained in the vegetative phase throughout these experiments, and internode 1 is the youngest visible internode below the apical dome. Photographs of cross sections of each internode taken every 1 cm are shown to the right of the stem in (a). No AER is visible in internodes 1–3 or in the lower portion of internode 4. AER formation begins in the top of internode 4 in the center of the internode. AER forms in a basipetal manner and spreads radially outward. Scale bar = 1 cm. (b) AER was rated on a scale from 1 (no AER) to 5 (high AER). Ratings of pairs of adjacent sections of internode 4 (int4) were averaged. AER formation of internodes 5–7 was rated 2 cm from the top node of each internode (int5‐1, int6‐1, int7‐1) and 2 cm from the bottom node of each internode (int5‐2, int6‐2, int7‐2). Each rating is the average of five biological replicates. Tukey's multiple comparison test was used to compare ratings of each internode section. Sections with different letters are significantly different from each other, p < 0.05. (c) Relative expression of SbNAC_D across internode sections of R07020. Expression of SbNAC_D is correlated with AER formation (Spearman's r = 0.709). Relative expression was calculated via the method relative to the internode section with the highest expression (Pfaffl, 2001). Expression values are the average of three biological replicates. Fold change in expression between the minimum and maximum values on the y‐axis was calculated based on SbUBC normalized values according to
