
Figure 6.
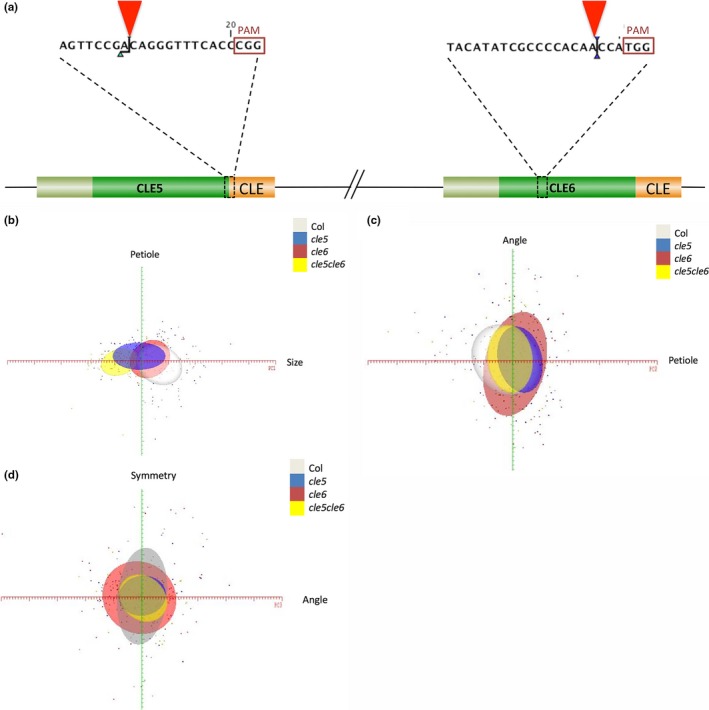
CLE5 and CLE6 loss‐of‐function allele generation and role in leaf formation. (a) Locations of the cle5 and cle6 CRISPR‐Cas9 induced mutations (red arrowheads) upstream of the PAM site (red box) within the sgRNA for the CLE5 and CLE6 coding sequences. The coding sequences of the signal peptides are represented in olive, the variable domains in green, and the CLE domains in orange. (b–d) Two‐dimensional PC maps generated using ≥5 standard deviations from the mean leaf along the X‐axis PC (red) and ≥2.5 standard deviations along the Y‐axis PC (green). Each standard deviation is represented by a major tick on the axis, and each leaf measured is represented by a single colored point. (b) Variation along PC1 and PC2 for Col‐0 (white oval), cle5 (blue oval), cle6 (red oval), and cle5 cle6 (yellow oval) leaves. (c) Variation along PC2 and PC3 for each genotype. (d) Variation along PC3 and PC4 for each genotype