
Fig 6. The expression levels of PI3K, PTEN and GLUT4 were analyzed in the IUGR offsprings with early catch-up growth.
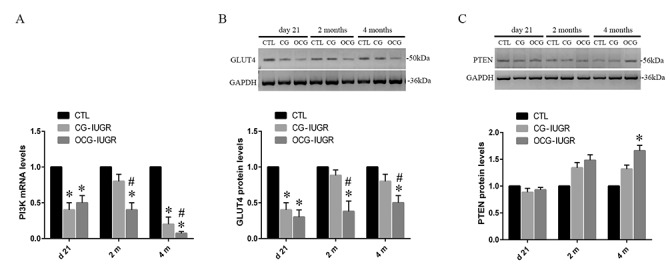
The mRNA levels of PI3K (A), as well as the protein levels of the GLUT4 (B) and PTEN (C) were assessed and compared among the controls and IUGR offsprings with catch-up (CG) or over catch-up growth (OCG). Data are shown as mean ± SD. n = 15 (CTL), 6 (CG-IUGR), and 4 (OCG-IUGR). *p <0.05 vs. CTL; #p <0.05 vs. IUGR-CG.