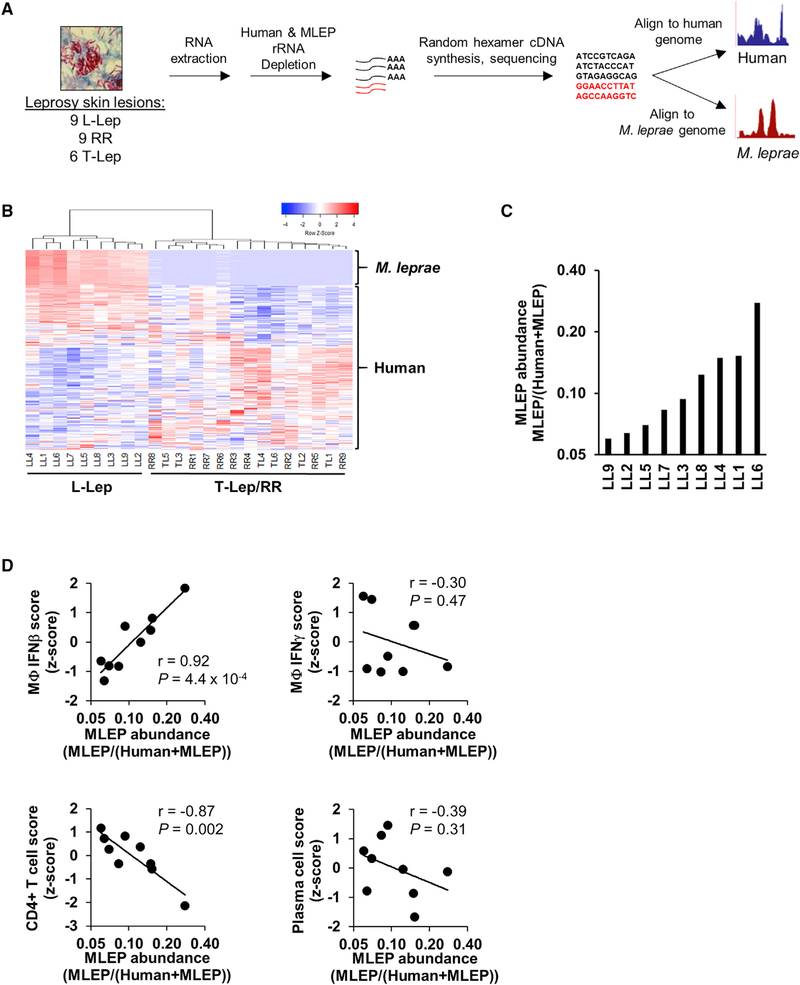
Figure 1. In Situ Dual RNA Sequencing of Host-Pathogen Transcriptomes.
(A) Experimental design for dual RNA-seq RNA extraction, library preparation, and sequence processing.
(B) Unsupervised clustering analysis of both M. leprae and human gene expression across leprosy skin lesions (coefficient of variation, >1.0). Heatmap represents expression of genes (rows) and patients (columns) in which red indicates a higher and green a lower expression Z score per gene across patients (n = 24).
(C) Ratio of the sum of all M. leprae gene abundances over the total sum of human or M. leprae gene abundance across L-lep patient lesions.
(D) Correlation plots of M. leprae abundance (log2 scale) against indicated Signature Visualization Tool (SaVanT) signature values (Z score) for IFN-b, IFN-g, CD4+ T cells, or plasma cells per L-lep patient. p value by Student’s t test (n = 9).
See also Table S1 and Figures S1 and S4.

