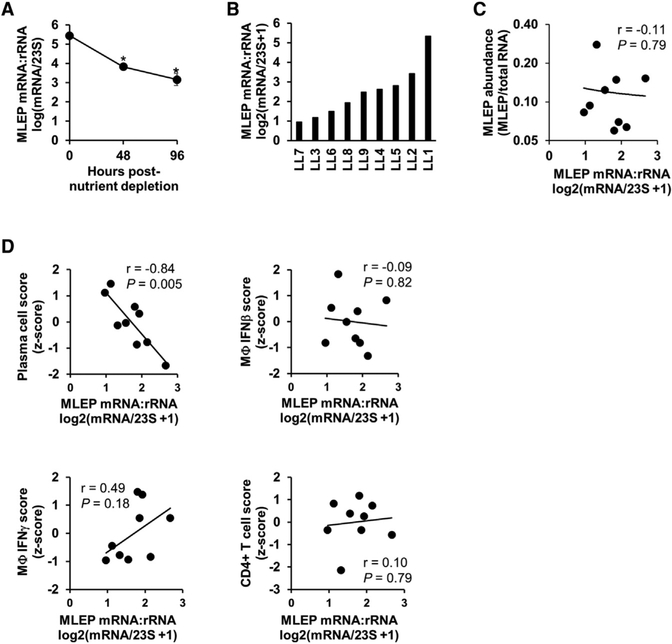
Figure 2. Measure of M. leprae mRNA:rRNA Ratio.
(A) M. leprae derived from the footpad of nu/nu mice were isolated and cultured in vitro under starvation conditions for 0 h, 48 h, or 96 h before RNA extraction and RNA sequencing. Data are shown as mean transcriptional activity ± SEM per time point (n = 2). *p < 0.05 by Student’s t test.
(B) Ratio of the log2(x + 1)-transformed sum of all M. leprae mRNA genes divided by 23S RNA abundance per L-lep lesion.
(C) Plot of RNA abundance versus mRNA:rRNAM. leprae measures per L-lep patient.
(D) Scatterplots of M. leprae transcriptional activity versus indicated SaVanT signature score per L-lep patient. p value by Student’s t test (n = 9).
See also Table S2 and Figures S2, S3, and S4.

