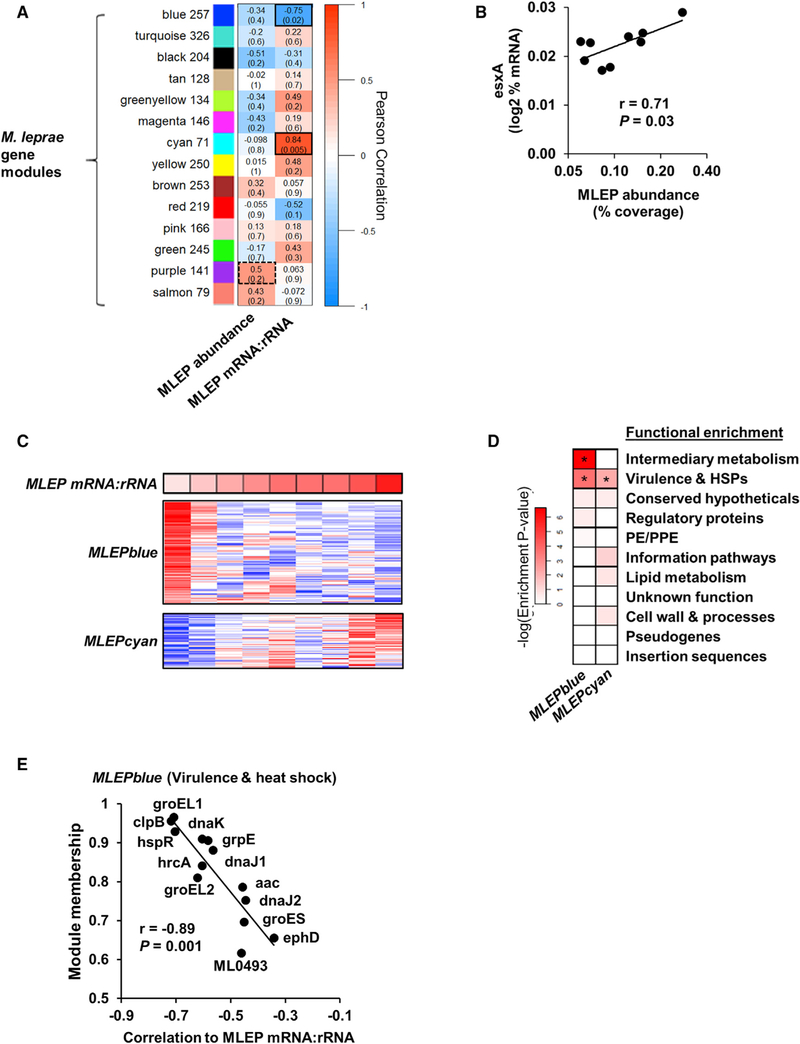
Figure 3. Module Analysis of M. leprae Transcriptome.
(A) Unsupervised weighted gene-correlation analysis (WGCNA) of the M. leprae gene expression across the nine L-lep patients. Heatmap represents the correlation of the module eigengene (rows) versus bacterial measure (columns) in which red indicates a positive and blue a negative Pearson correlation across patient samples. Number of genes per module indicated beside module color. Black outlines indicate highest and lowest correlation values.
(B) Correlation plot of the MLEPpurple module gene, esxA, and the M. leprae abundance per L-lep patient (n = 9).
(C) Heatmap of MLEPblue or MLEPcyan module protein-coding genes (pseudogenes excluded) across L-lep patients in order of M. leprae mRNA:rRNA (top). High or low relative expression indicated by red or blue, respectively.
(D) Functional category enrichment of genes within the MLEPblue or MLEPcyan modules. Heatmap color indicates the negative logarithm of the hypergeometric enrichment p value per functional category. *p % 0.05.
(E) Plot of the WGCNA module membership and the correlation to the M. leprae mRNA:rRNA per gene from the MLEPblue virulence and heat shock genes. p value by Student’s t test (n = 9).

