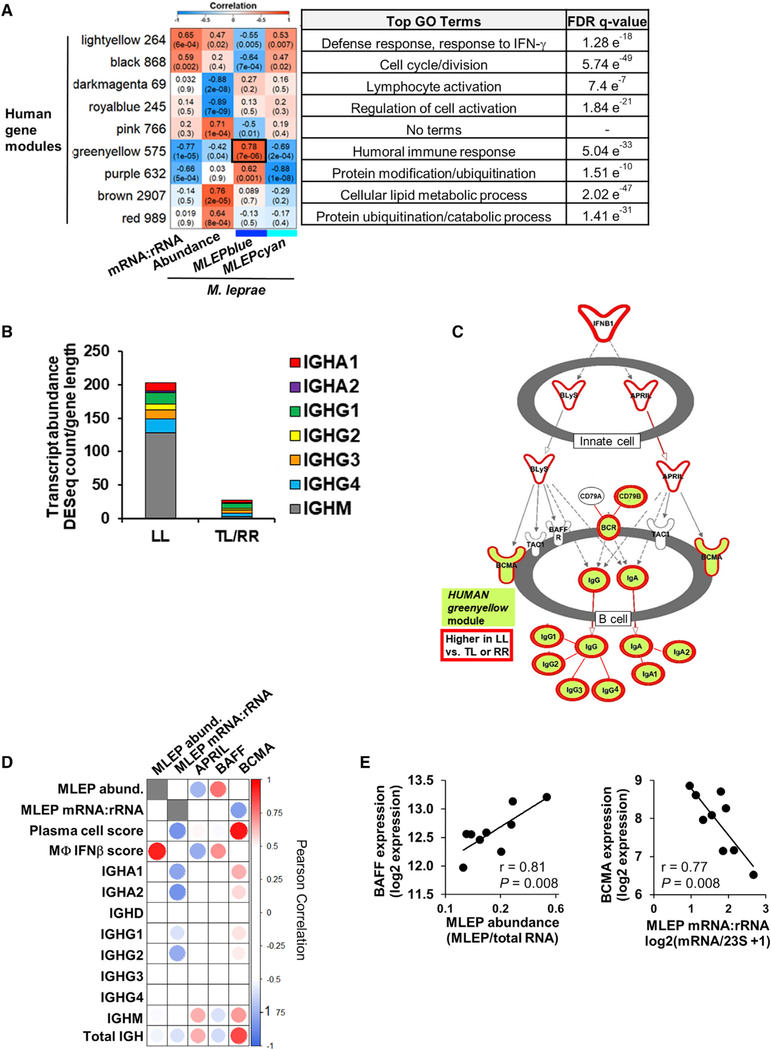
Figure 4. Interactions between Host and Pathogen Transcriptomes.
(A) WGCNA of the human gene expression across all leprosy patients (n = 24). Heatmap represents the correlation of the host module eigengene (rows) versus bacterial measure (columns) in which red indicates a positive and blue a negative Pearson correlation across only the nine LL patient samples. Only modules with a significant correlation (p < 0.001) in at least one bacterial measure or module eigengene are shown. Black outline indicates most significant positive correlation. Number of genes per module indicated beside module color and top gene ontology terms for module genes listed on right with the false discovery rate (FDR) q-value for enrichment per module.
(B) Mean abundance of IGH immunoglobulin constant regions per leprosy clinical subtype (LL, n = 9; tuberculoid leprosy and reversal reaction leprosy [TL and RR], n = 15).
(C) Ingenuity pathways canonical pathway communication between innate and adaptive immune cells. Only the section of pathway containing enriched genes is shown. HUMANgreenyellow module genes shaded green and genes significantly higher in LL versus TL and RR patients (fold change, ≥1.5; padj ≤ 0.05 outlined in red; Bonferoni-adjusted p value by Wald test).
(D) Correlation heatmap of BAFF and APRIL ligands and BCMA receptor expression versus M. leprae bacterial measures, human SaVanT plasma cell and IFN-β signature score, and individual immunoglobulin IGH constant region genes across L-lep patients. High or low Pearson correlation indicated by red or blue, respectively.
(E) Correlation plots of M. leprae bacterial measures across L-lep skin lesions versus BAFF or BCMA expression. p value by Student’s t test (n = 9).
See also Figures S4 and S5 and Table S3.

