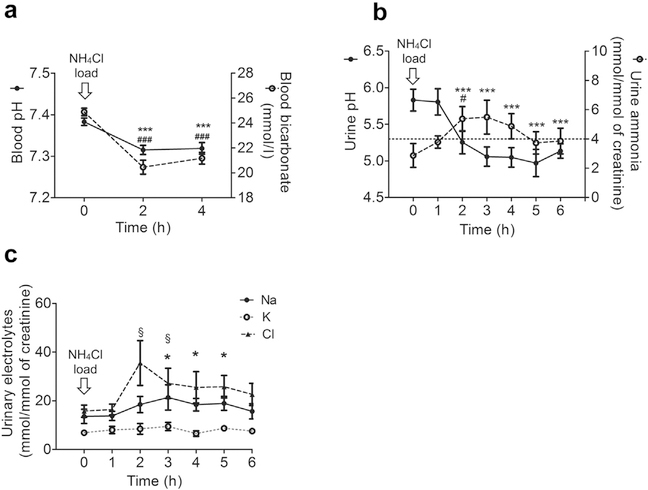
Figure 2 |. Blood and urinary parameters during NH4Cl loading.
Time 0 represents baseline (prior to NH4Cl ingestion). Arithmetic mean ± SEM of different parameters (n = 8). (a) Blood pH and bicarbonate. The * and # symbols indicate comparison of pH and bicarbonate, respectively, with reference to baseline; the number of these symbols indicates significance. (b) Urine pH and ammonia excretion. The * and # symbols indicate comparison of pH and ammonia, respectively, with reference to baseline; the number of these symbols indicates significance. (c) Urinary Na, K, and Cl excretion. The * and § symbols indicate comparison of Na and Cl excretion, respectively, with reference to baseline; the number of these symbols indicates significance. Urinary K excretion was not found to be significantly different during the course of experiment. Data are mean ± SEM; n = 8. */#/§P < 0.05; ***/###P < 0.001 compared with baseline.

