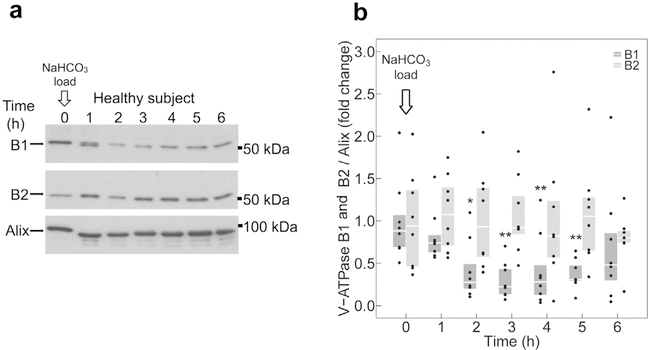
Figure 5 |. Effect of NaHCO3 on B subunit abundance in urinary exosomes.
(a) Representative immunoblots of urinary exosomes isolated from a single participant, probed with B1 (upper panel), B2 (middle panel), or alix (lower panel) antibody. (b) Quantification of immunoblots from 8 participants. B1 (dark gray boxplots) and B2 (light gray boxplots) subunit abundance were normalized to alix. All data were normalized to the respective baseline. Boxplots represent medians and interquartile ranges. Data points corresponding to each boxplot are presented. B1 and B2 at each time point are compared with baseline (time 0 hours) by Wilcoxon signed-rank test. *P < 0.05 and **P < 0.01 compared with baseline. To optimize viewing of this image, please see the online version of this article at www.kidney-international.org.

