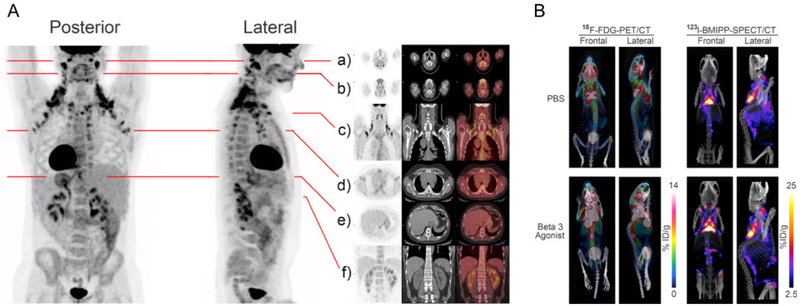
Figure 2:
A: Regions of High-Level glucose Uptake in Humans as Assessed by 18F-FDG-PET/CT. Frontal and lateral maximal PET intensity projection images in an adult male subject imaged at room temperature show distribution of glucose uptake, mainly in the cervical, supraclavicular, axillary, intercostal, mediastinal, ventral spinal, and perirenal areas. Paravertebral tissue is also activated. Fat pads are also illustrated in multi-level transaxial or coronal PET/CT images (a–f). B: Anatomical Location of Metabolically Active Fat Pads in mice as Assessed by PET/CT and SPECT/CT. 18F-FDG-PET/CT images show glucose uptake and distribution in the thermogenic tissues (left) and 123I-BMIPP-SPECT/CT show the patterns of fatty acid uptake in the metabolic active tissues (right) of an adult mouse kept at room temperature treated with 7 days of PBS (top) or β3 agonist (bottom). Reproduced with permission from [48].

