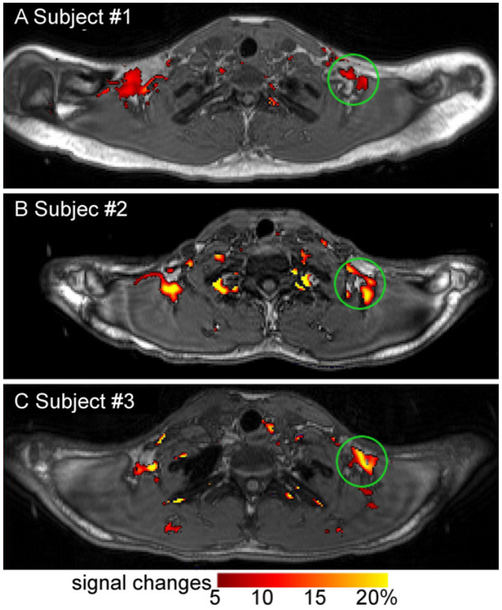
Figure 4:
MRI detection of BAT activity upon cold challenge (13°C-16°C). Degree of BOLD signal changes (red-yellow map) is superimposed on anatomical images (in grey scale). Upon cold stimulation, significant BOLD signal increases were found in the regions identified as having BAT for subjects #1 - #3 (such as areas indicated by green circles). Reproduced from [75] under CC-BY-NC license

