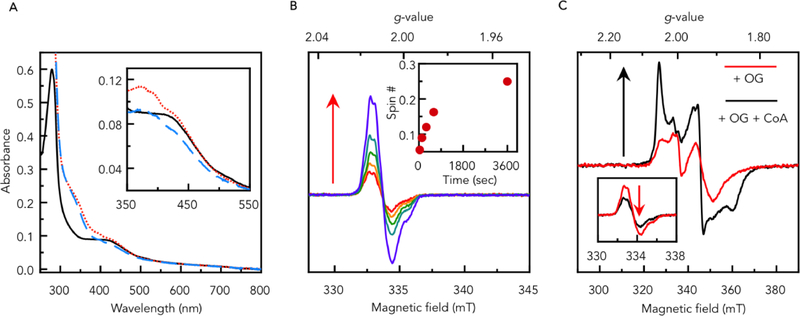
Figure 2. Spectroscopic properties of MmOGOR.
(A) UV-vis spectra of 5 μM as-purified MmOGOR (black solid line), first incubated with 5 mM 2-oxoglutarate (OG) for 15 min (red dotted line), and then supplied with 0.1 mM coenzyme A (CoA) for additional 5 min (blue dashed line). The spectra between 350 nm and 550 nm are shown in the inset with the background absorbance of OG and CoA subtracted. (B) EPR spectra of 70 μM MmOGOR incubated with 20 mM OG at room temperature for 30 sec, 2 min, 5 min, 10 min and 60 min measured at 52K. Spin quantification of each time point is shown in the inset. Experimental conditions: microwave frequency, 9.386 GHz; microwave power, 10 μW; modulation amplitude, 0.2 mT. (C) EPR spectra of 70 μM MmOGOR incubated with 20 mM OG at room temperature for 30 sec (red) and the same sample supplied with 1 mM CoA for additional 10 sec (black) measured at 15K. Experimental conditions: microwave frequency, 9.384 GHz; microwave power, 4 mW; modulation amplitude, 0.5 mT. The same samples measured at the same condition as panel (B) are shown in the inset.

