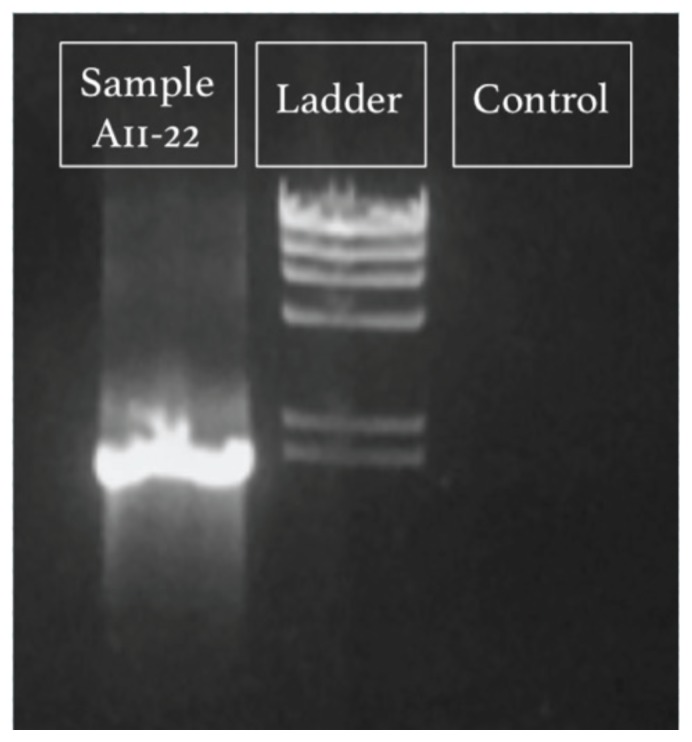
FIGURE 3.
Example gel electrophoresis image of a successful 16S rRNA gene PCR amplification from fall 2015. Lanes labeled according to contents: “Sample A11–22” is the amplicon from isolate DNA (expected size 1,466 bp); “Ladder” is Lambda HindIII digest ladder (NEB N3012S), with the lowest visible band at 2,027 bp; “Control” is the negative control (water).

