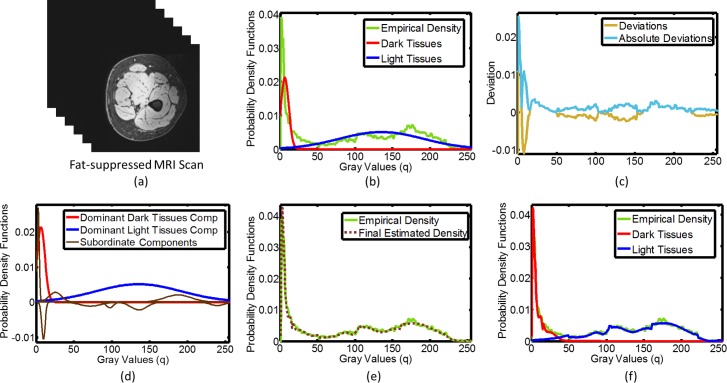
Fig 2. An Example for applying LCDG algorithm MRI 3-D volumes.
LCDG algorithm output on (a) exemplary 3D FS-MRI image data; (b) probability density functions of the image voxels in Fig 2A, as determined empirically, and as approximated via LCDG using two dominant DGs; (c) the deviations (standard and absolute) between the empirical and estimated marginal probability density functions in Fig 2B; (d) LCDG algorithm output on the dominant and subordinate DGs in the image data in Fig 2A; (e) the final estimated LCDG model of the empirical density function; and (f) the final LCDG output of the conditional probability density functions of light tissue (muscle) and dark tissue (fat) intensities and the empirical density function.

