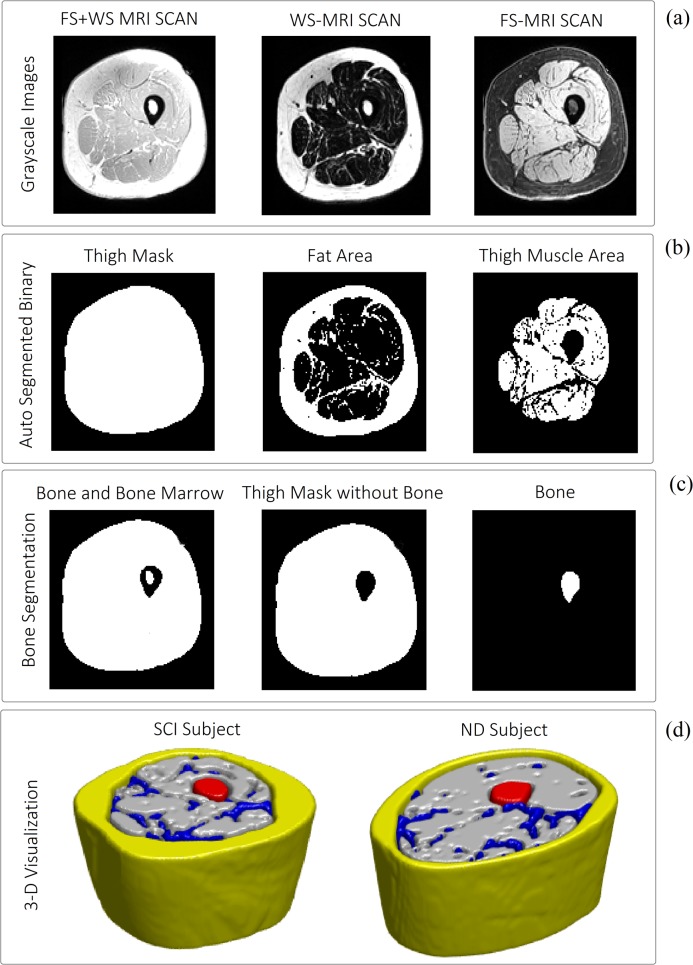
Fig 4. Examples for the utilization of LCDG to segment the soft tissue volumes.
(a) From left to right: gray scale MR images for FS+WS, WS and FS; (b) From left to right: binary mask of total thigh area, total fat and total muscle area; (c) From left to right: steps for segmenting the bone and bone marrow; (d) 3-D representations of the segmentation results for SCI (left) and ND (right) thigh; Grey: Muscle area, Yellow: SAT, Blue: IMAT, Red: bone.

