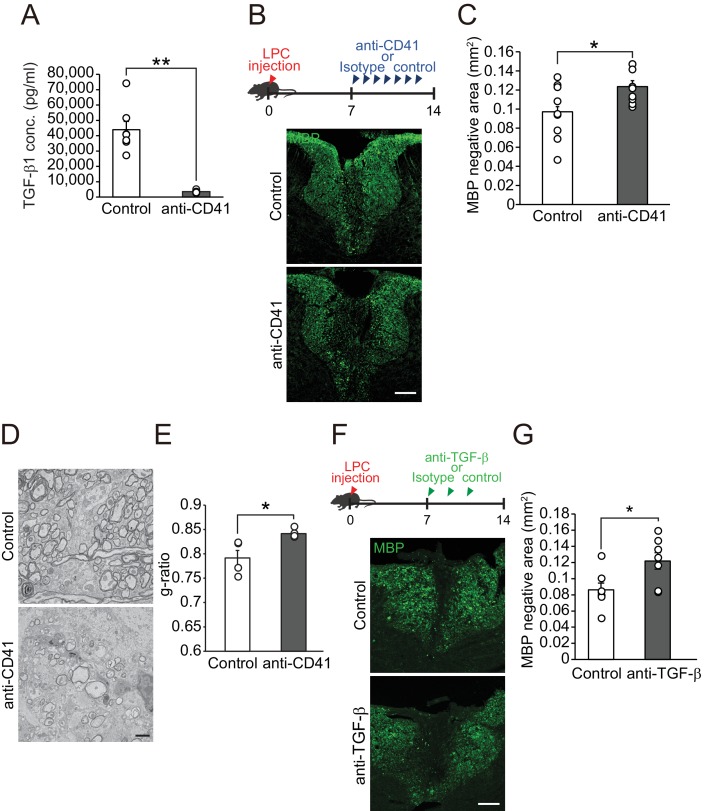
Figure 3. Circulating TGF-β1 supports spontaneous remyelination.
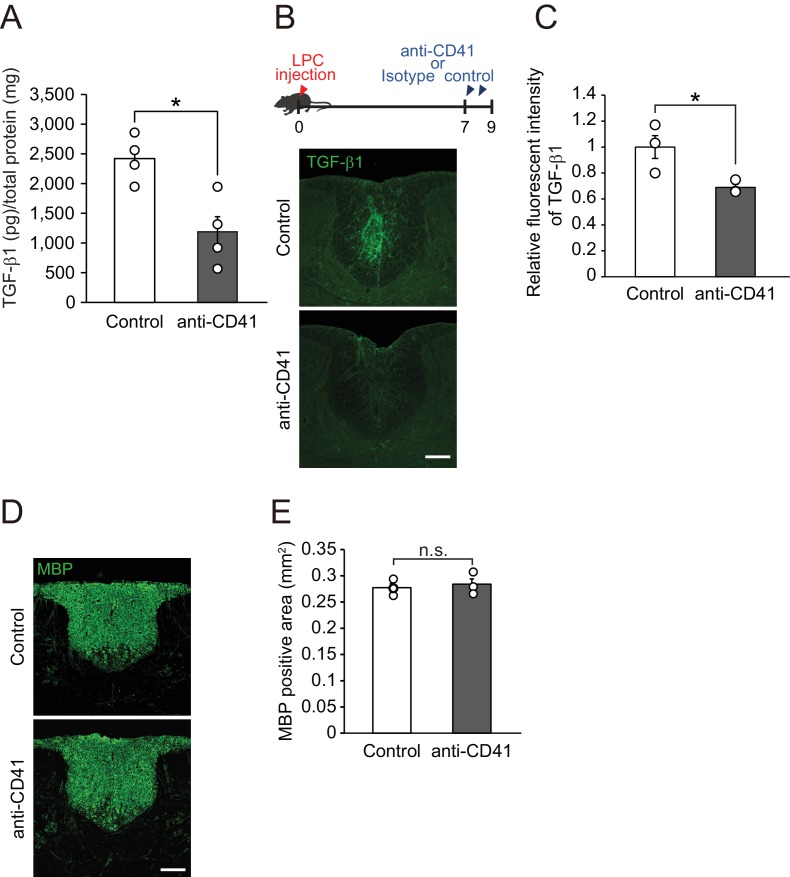
(A) Quantification of circulating TGF-β1 level in the mice with platelet depletion. Plasma from mice were obtained from 7 days after the start of anti-CD41 mAbs injection (n = 7 for control IgG, n = 8 for anti-CD41 mAbs), p=0.0001. (B) Representative images of spinal cord sections labeled for MBP. Spinal cords were dissected from mice 14 days after LPC injection. (C) Quantification of an MBP-negative area in the dorsal column of spinal cord as indicated in B (n = 9 for each), p=0.0347. (D) Representative electron micrographs of myelin in the spinal cord. Sections were obtained from mice treated with anti-CD41 mAb 14 days after LPC injection. (E) Graphs show quantitation of the g-ratio indicated in D (n = 4 for each), p=0.0347. (F) Representative images of spinal cord sections labeled for MBP. Spinal cords were obtained 14 days after LPC injection. Injection of TGF-β neutralizing antibodies was started 7 days after LPC and continued every other day (n = 7), p=0.0278. (G) Quantification of an MBP-negative area in the dorsal column of spinal cord, as indicated in F. NS indicates not significant difference. **p<0.01, *p<0.05, Student’s t-test. Error bars represent SEM. Scale bars represent 100 μm for B, F, 2 μm for D.


