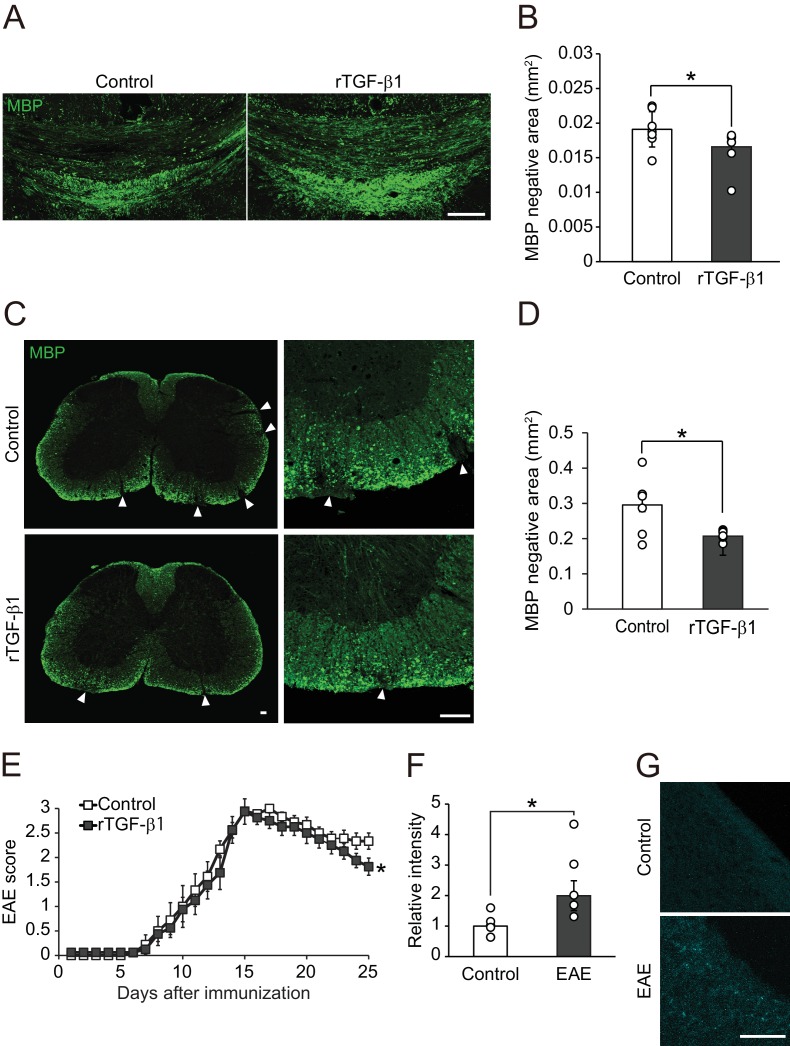
Figure 5. TGF-β1 treatment promotes remyelination.
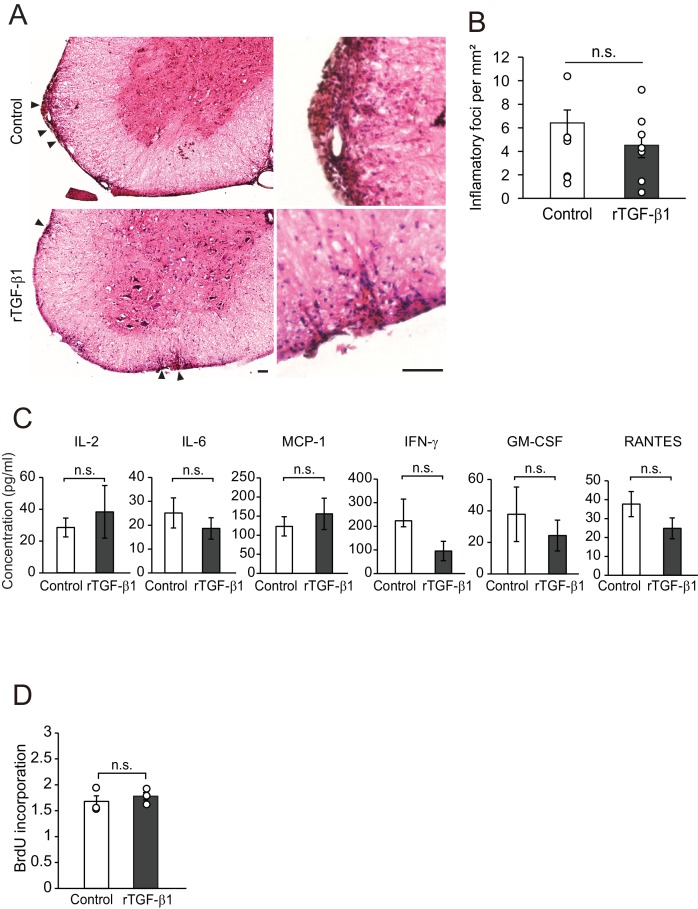
(A) Representative image of brain section labeled for MBP. Brains were obtained from the cuprizone fed mice, along with TGF-β1 administration for 14 days after removal of cuprizone diet. (B) Quantification of MBP-negative area in the corpus callosum as indicated in A (n = 7 for control, n = 8 for TGF-β1), p=0.0444. (C) Representative image of spinal cord section labeled for MBP. Spinal cords were dissected from the mice 25 days after EAE induction. Right panels show high magnification of left panels. (D) Quantification of MBP-negative area in the spinal cord as indicated in C (n = 7 for each), p=0.0125. (E) EAE score of the mice with TGF-β1 administration. TGF-β1 administration was started 15 days after EAE induction and continued daily injection at the end of period (n = 13 for control, n = 12 for TGF-β1), p=0.049. (F) Relative intensity of fluorescent dye-labeled recombinant mouse TGF-β1 in the spinal cord obtained from EAE mice (n = 6 for control, n = 5 for EAE), p=0.0193. (G) Representative image of spinal cord section from EAE mice. EAE mice received fluorescent-dye-labeled recombinant mouse TGF-β1. *p<0.05, Student’s t-test or two-way ANOVA with Bonferroni’s post-hoc test. Error bars represent SEM. Scale bars represent 100 μm.


