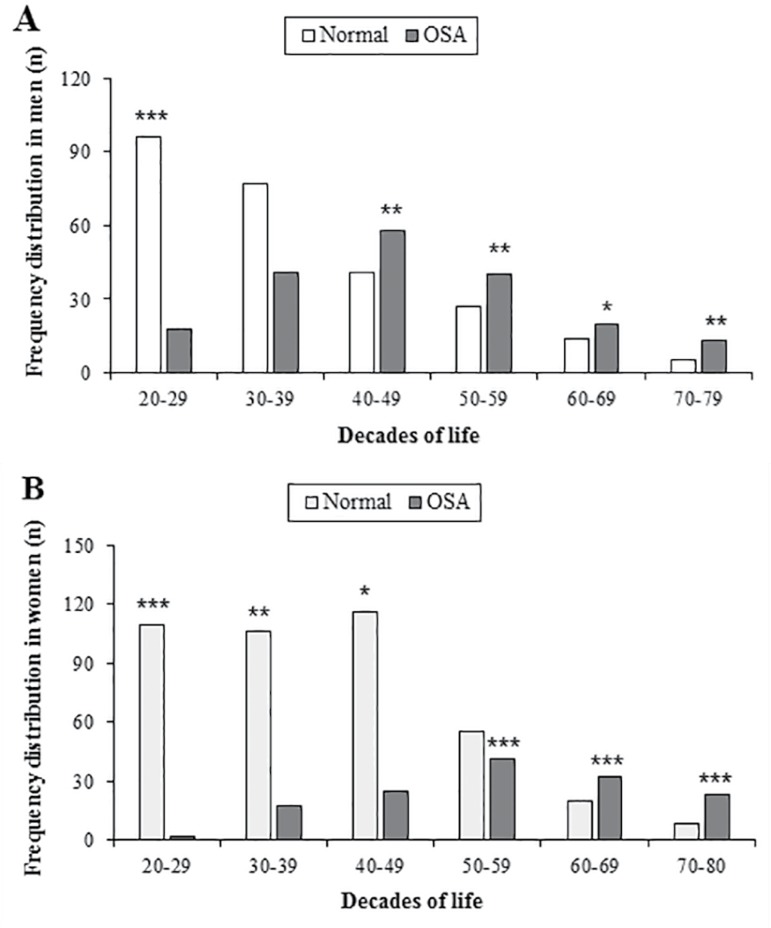
Figure 2.
A. Frequency distribution of patients with OSA by decades of life in men. Legend: Significant difference *(p<0.05), **(p<0.01) and ***(p<0.001) B. Frequency distribution of patients with OSA by decades of life in women. Legend: Significant difference *(p<0.05), **(p<0.01) and ***(p<0.001).

