
FIG. 10.
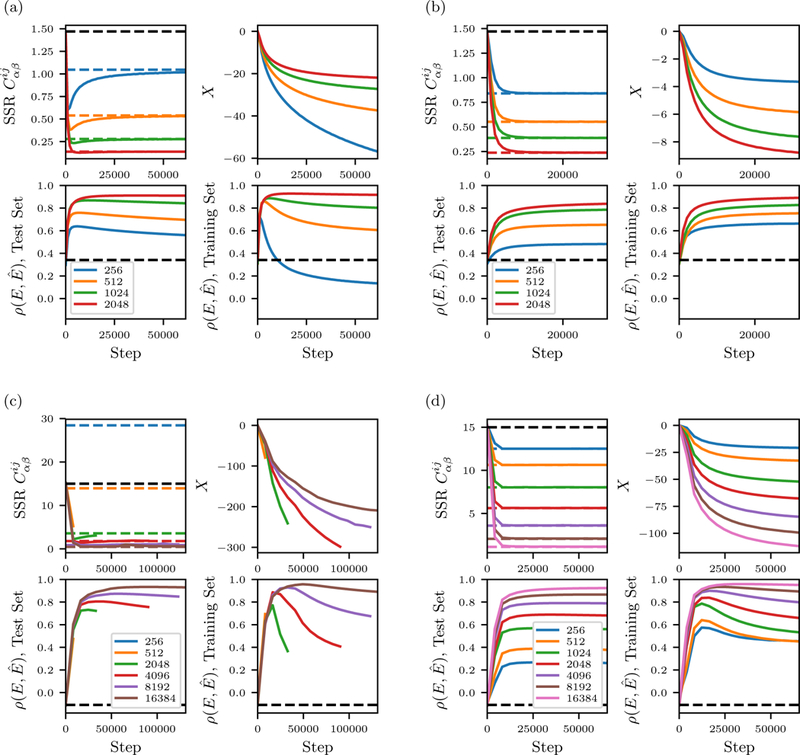
Inverse Ising inference equilibration for different in silico MSA depths N, for different model inferences: (a) unregularized SH3, (b) regularized SH3, (c) unregularized kinase domain, (d) regularized kinase domain. In all plots the x axis shows number of coupling-updates during inference. For each of the models there are four subplots. Upper left subplots: Error in the model’s correlation statistics relative to the reference model, measured as the sum of squared residuals (SSR) of the correlation coefficients Dotted lines are the SSR of the training MSA relative to the reference, plus the independent model in black. Upper right subplots: Total correlation energy X as a function of step. The independent model has X = 0 by definition. Lower left supblots: for a test MSA of 4096 sequences drawn from the reference model. The black dotted line is the correlation of the independent model. Lower right subplots: when scoring the training MSA sequences.