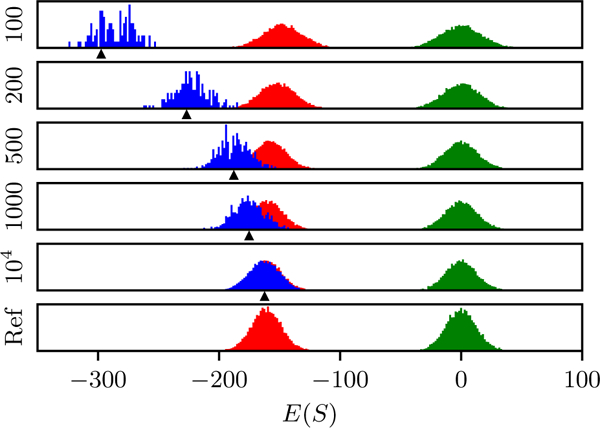
FIG. 3.

Numerical tests of overfitting in the independent model. Each row corresponds to an independent model fit to a “training” MSA data-set with different MSA depth N, generated from a reference independent model with L = 1000, q = 16, and A pseudocount of 1/N is used to avoid issues with unsampled residues. The green distribution shows estimated energies of “random” sequences with equal residue probabilities, the blue distribution shows energies of the training MSA, and the red distribution are energies of a “test” MSA independently generated from the reference model. The black arrow on the x axis marks the expected energy of the training MSA based on the mean energy of the test MSA minus the shift δE computed using Eqs. 5 and 7, showing good agreement. The models are evaluated in the zero-mean gauge.
