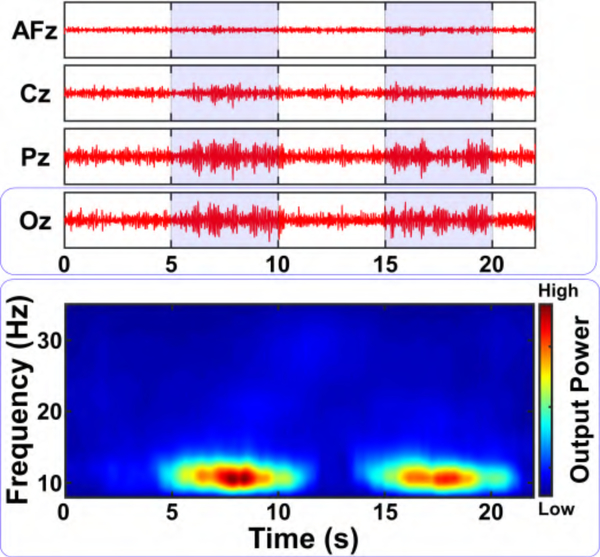
Fig. 15.
BSA II EEG α/β-band (8−35 Hz) time-series data (top) and spectrogram (bottom) from channel AFz, Cz, Pz, and Oz (all referenced to AFz) as the subject was instructed to alternate between eyes-open (white background) and eyes-closed (blue background). The channel-multiplexed data from the custom designed IC were demultiplexed in software.

