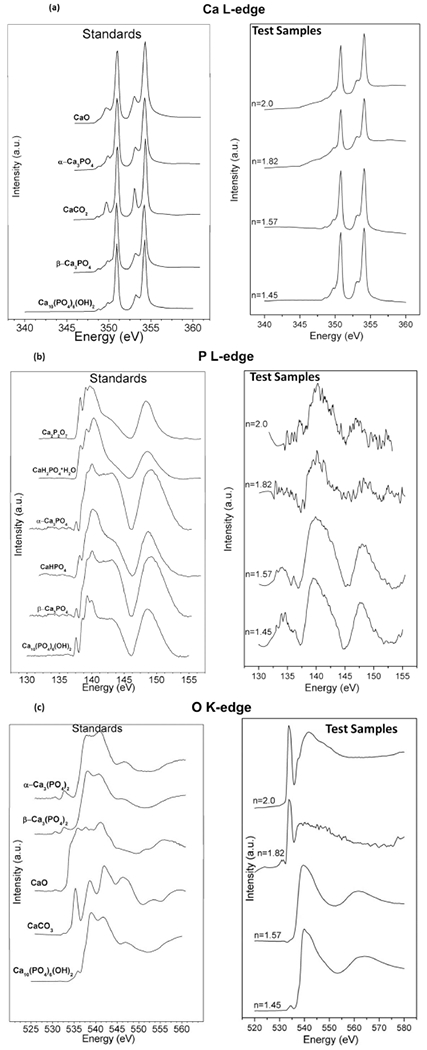
Figure 4.

X-ray absorbance near edge structure (XANES) spectroscopy. Comparative data for (L) standards and (R) PECVD-based SiOx (n = 1.45), Si(ON)x (n = 1.57, n = 1.82), and SiNx (n = 2.0) samples where “n” represents the refractive index for the characteristic surface. Test samples were investigated after 6 h of in vitro immersion to examine the presence of (a) calcium, (b) phosphorus, and (c) oxygen on the surface of each sample. The data analysis reveals the formation of hydroxycarbonate apatite with higher carbonate to phosphate ratio as the N/O ratio increases in the overlay.
