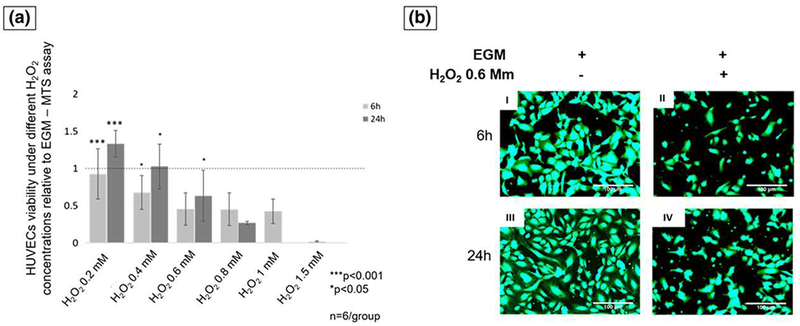
FIGURE 1.

(a) The cells number relative to control at 6- and 24-hr time points. At 24-hr, H2O2 0.6 mM was significantly lower than 0.4 mM and higher than 0.8 mM (ANOVA, ***p < 0.001, *p < 0.05 indicate statistical significance, n = 6 per group). (b) Fluorescent pictures of human umbilical vein endothelial cells (HUVECs) stained with Calcein-AM at 6 hr (I and III) and 24 hr (II and IV). Pictures I and III show cells exposed to endothelial cell growth media (EGM), and pictures II and IV show cells exposed to EGM and hydrogen peroxide (H2O2; scale bar = 100 μm) [Colour figure can be viewed at wileyonlinelibrary.com]
