
FIGURE 3.
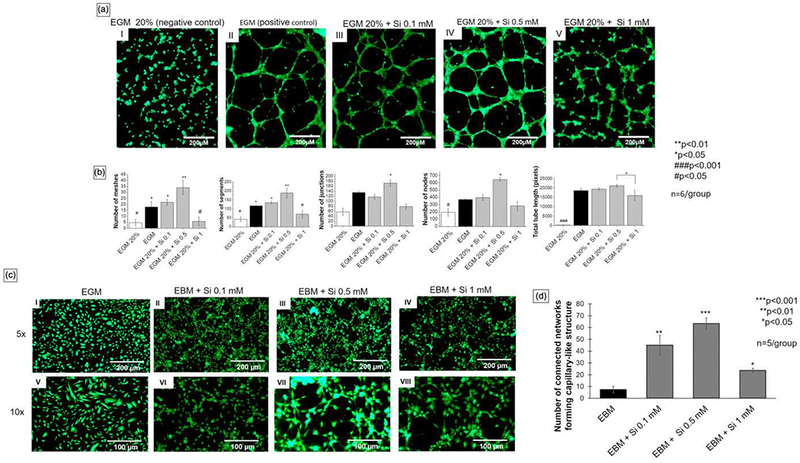
(a) Pictures I, II, III, IV, and V show fluorescent pictures (5× view) of human umbilical vein endothelial cells (HUVECs) stained with Calcein-AM, 6 hr after seeding on bed of Matrigel. Si4+ 0.5 mM presented the best parameters among all groups, especially on the number of meshes and nodes (scale bar = 200 μm). (b) Analysis of data collected from ImageJ. Si4+ 0.5 mM presented significantly higher number of meshes, segments, junctions, and nodes when compared with other groups. (c) Fluorescent pictures of HUVECs stained with Calcein-AM, 3 hr after media change and 27 hr after initial cell seeding. Pictures I and V (control) show a low number of circles (5× view, scale bar = 200 μm). Pictures II, III, IV, VI, VII, and VIII represent the cells exposed to different silicon ion concentrations and show a higher number of circular structures, similar to precapillary tubes. (d) Bar graph showing the data analysis from the fluorescent pictures of number of connected networks formed according to group relative to control (EBM). EBM + Si4+ 0.5 mM produced the most remarkable results followed by 0.1 mM and 1 mM (10× view, scale bar = 100 μm; ANOVA, ***p < 0.001, **p < 0.01, *p < 0.05, ###p < 0.001, #p < 0.05 indicate statistical significance). EBM: endothelial cell basal media; EGM: endothelial cell growth media [Colour figure can be viewed at wileyonlinelibrary.com]