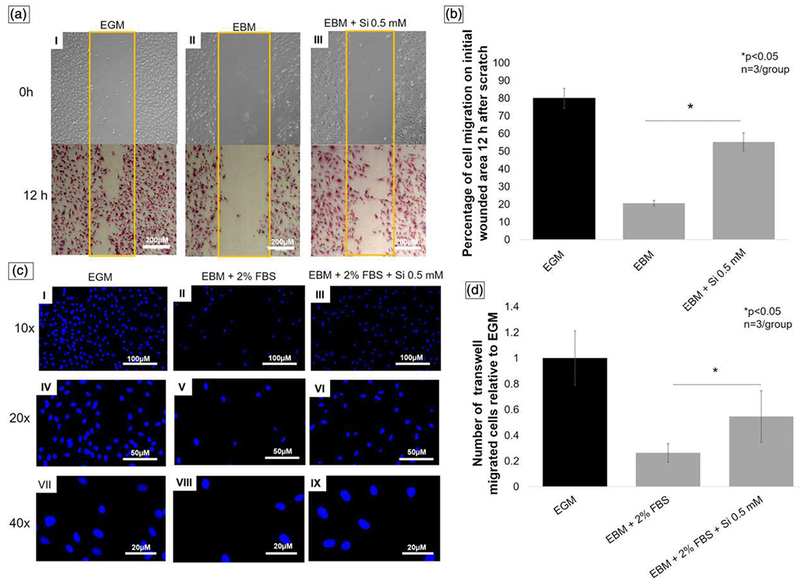
FIGURE 4.

(a) Scratch wound healing assay. Pictures (5× view) of wounded area on time 0 hr (no staining) and 12 hr (toluidine blue staining). Picture I shows EGM (positive control) group with higher wounded area occupied by migrated cells. Picture II shows EBM (negative control) group with lower number of cells on wounded area, and picture III represents EBM treated with Si4+ 0.5 mM showing the increase of silicon on cell migration, as compared with EBM (picture II; scale bar = 200 μm). (b) Graph shows percentage of occupied initial wounded area by migrated cells relative to control (EGM) 12 hr after scratch. EBM + Si4+ group presented almost three times more occupied area than EBM without silicon. (c) Fluorescent pictures of human umbilical vein endothelial cells stained with DAPI 12 hr after transwell cell migration. Pictures I, IV, and VII show EGM (positive control), pictures II, V, and VIII EBM + 2% FBS (negative control), and pictures III, VI, and IX silicon treatment group (10× view, scale bar = 100 μm; 20× view, scale bar = 50 μm; 40× view scale bar = 20 μm). (d) Bar graph presents number of transwell migrated cells relative to EGM (positive control). Silicon treatment group showed two times more cell migration than negative control (ANOVA, *p < 0.05 indicates statistical significance; n = 3 per group). EGM: endothelial cell growth media; EBM: endothelial cell basal media. FBS: fetal bovine serum [Colour figure can be viewed at wileyonlinelibrary.com]
