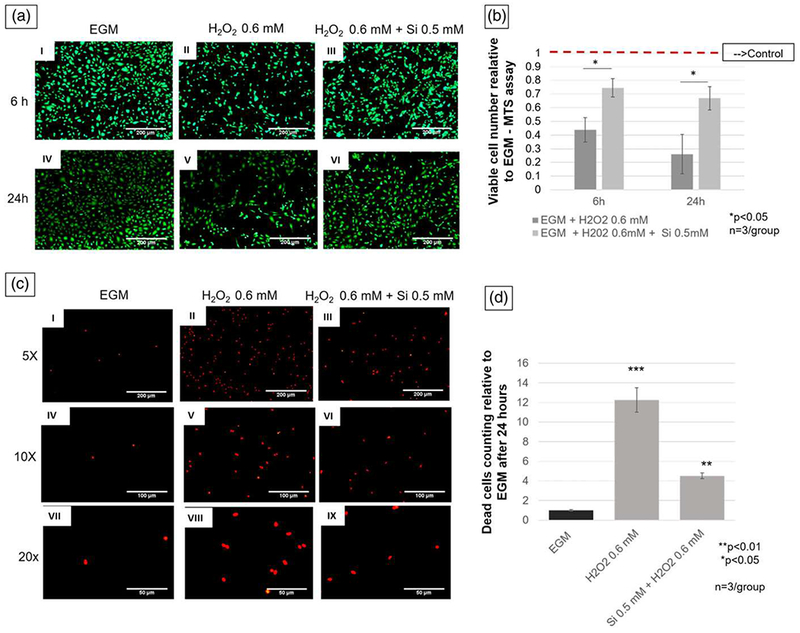
FIGURE 5.

(a) Pictures (5× view) of human umbilical vein endothelial cells stained with Calcein-AM under hydrogen peroxide oxidative stress with and without silicon ion treatment, as compared with control. Pictures I and IV show EGM (control) group. Pictures II and V show cells exposed to H2O2, and pictures III and VI show human umbilical vein endothelial cells under H2O2 environment and treated with Si4+ 0.5 mM (scale bar = 200 μm). (b) Graph presents data of comparison between treated and nontreated group relative to control (EGM). Treatment group shows twice and three times more viable cells than H2O2 0.6 mM group at 6 and 24 hr, respectively. (c) Fluorescent pictures after propidium iodide staining 24 hr after cell seeding. Pictures I, IV, and VII show different magnification of lowest number of dead cells on negative control (EGM). Pictures II, V, and VIII show different magnifications of highest number of dead cells on positive control (H2O2 0.6 mM). Pictures III, VI, and IX show lower number of dead cells than positive control (5× view, scale bar = 200 μm; 10× view, scale bar = 100 μm; 20× view scale bar = 50 μm). (d) Bar graph shows that silicon treatment group (H2O2 + Si 0.5 mM) have three times less dead cells than positive control (H2O2 0.5 mM). ***p < 0.001, **p < 0.01, *p < 0.05 indicate statistical significance; n = 3 per group). EGM: endothelial cell growth media [Colour figure can be viewed at wileyonlinelibrary.com]
