
FIGURE 6.
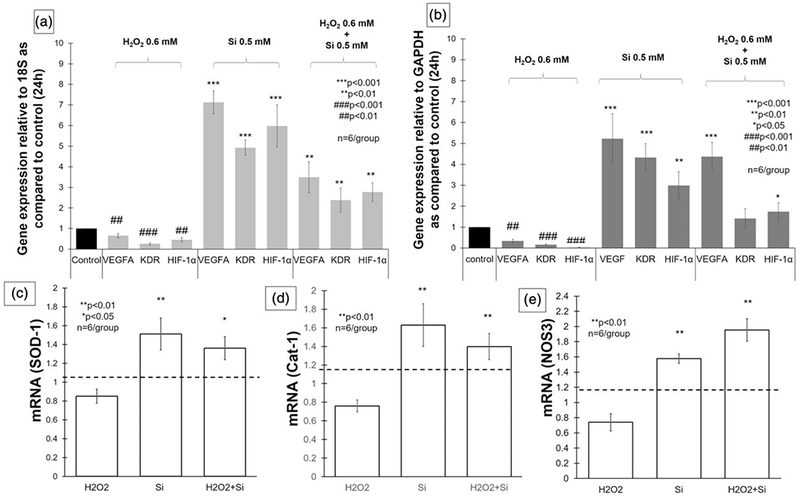
Bar graphs showing gene expression after 24 hr. (a) VEGFA, KDR, and HIF-1α were significantly underexpressed when human umbilical vein endothelial cells were exposed to H2O2 0.6 mM (p < 0.01), and over expressed on silicon group (p < 0.001) and H2O2 treated with silicon group (p < 0.01) relative to 18S, as compared with control (EGM 20%). (b) Bar graph presenting gene expression of VEGFA, KDR, and HIF-1α, 24 hr after cell seeding relative to GAPDH, as compared with control (EGM 20%). VEGFA, KDR, and HIF-1α underexpressed on H2O2 0.6 mM (p < 0.01) and presented significant overexpression on silicon group (p < 0.01). VEGFA (p < 0.001) and HIF-1α (p < 0.05) were significantly increased on cells exposed to H2O2 and treated with silicon. (c–e) Bar graphs showing gene expression of SOD-1, Cat-1, and NOS-3 relative to 18S and compared with control. The three enzymes were significantly overexpressed, when exposed to ionic silicon with and without H2O2 (ANOVA, **p < 0.01, *p < 0.05 indicate statistical significance; n = 6 per group). VEGFA: vascular endothelial growth factor-A; KDR (VEGFR-2): vascular endothelial growth factor receptor 2; HIF-1α: hypoxia-inducible factor 1-alpha; GAPDH: glyceraldehyde 3-phosphate dehydrogenase; EGM: endothelial cell growth media; SOD-1: superoxide dismutase-1; Cat-1: catalase-1; NOS3: nitric oxide synthase-3