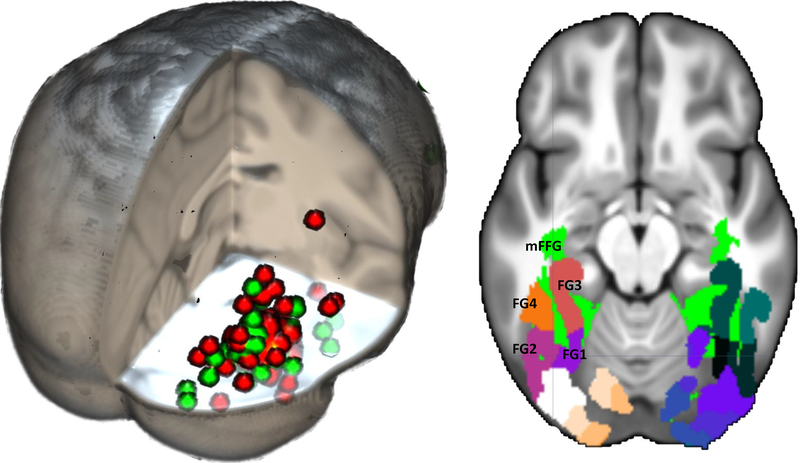
FIGURE 1.
Left: 3D rendering of the overlap between historical FFA locations (red circles) and N170 source locations (green circles). A list of the coordinates may be found in Richards et al., 2018 (tables 1, 2, 3, 5). Right: Anatomical ROIs shown on the 20–24 years average template. These regions include both the most relevant FFA literature locations (from Guy, Zieber, & Richards, 2016) and the ventral temporal-occipital visual areas for the fusiform gyrus (Rosenke et al., 2018). For all figures for fMRI, ERP, and cortical sources, the right side of the figure is the right side of the head

