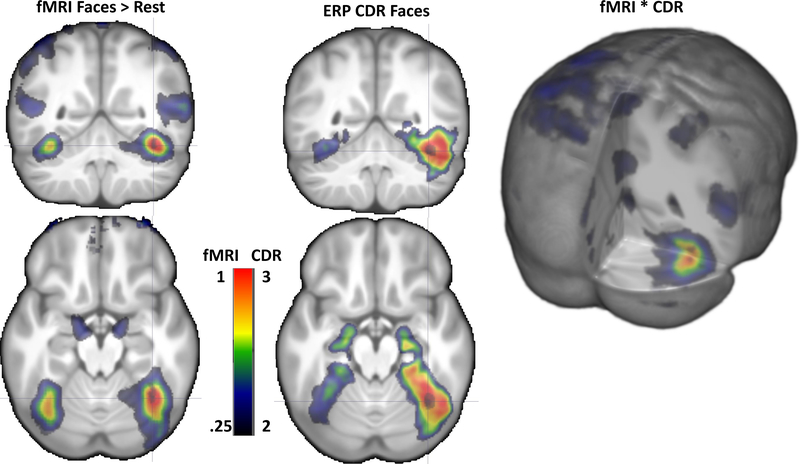
FIGURE 9.
Coronal and axial representations on the average MRI volume of the fMRI contrast (left), ERP CDR (middle). There was larger activity on the right than on the left side for both fMRI and ERP results, and the maximal value for both were in a similar location. 3D rendering representation of the fMRI × CDR shows the combined activity occurring the strongest in the posterior FFG

