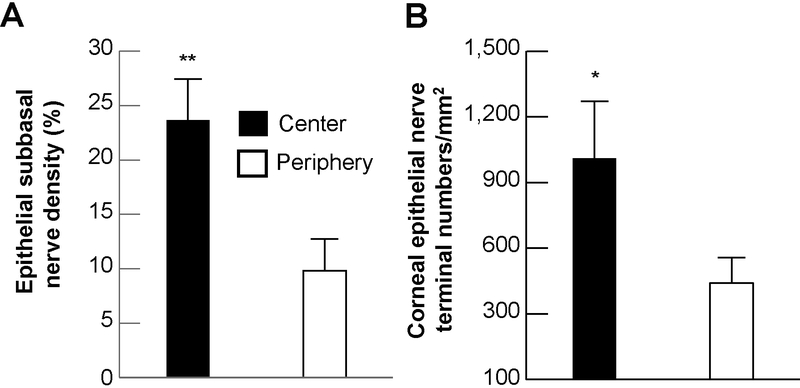
Figure 3.
Subbasal nerve density and number of nerve terminals in the center and periphery. A) Subbasal nerve density was calculated as percentage of total area in each image. Sixteen images from each zone of four corneas were used. B) The terminal numbers in each image (16 images/zone) were directly counted. Each image took up an area of 0.59 mm2, and the terminal numbers per mm2 were calculated. Data were expressed as average ± SD. Significant differences *p<0.005 and **p<0.001 between center and periphery zones.

