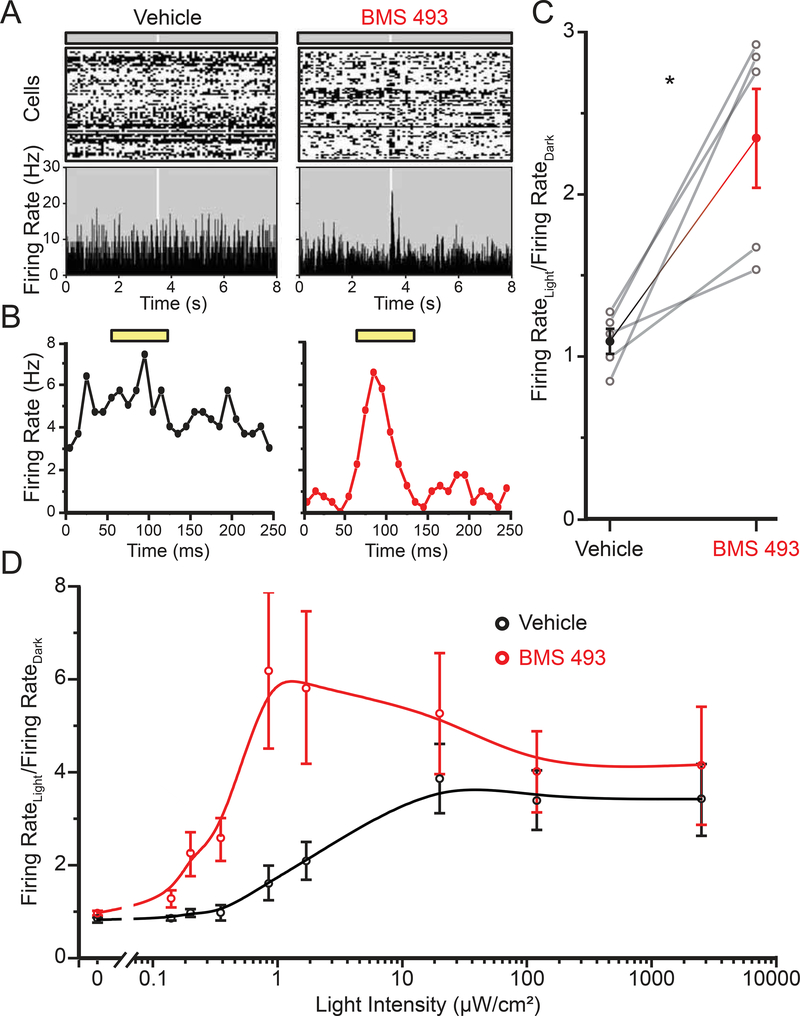
Figure 6. Inhibition of RAR activation reduces hyperactivity of RGCs and boosts light responses in rd10 vision-impaired mice.
(A) In partially degenerated retinas from P41–43 rd10 mice, response to a single dim light flash (white light, 50 ms, 0.2 μW) in normal saline, recorded with the MEA. Note the high spontaneous firing rate and lack of a light-response in the retina isolated from the vehicle-injected eye, and the lower spontaneous firing rate and transient light response in the retina from the BMS 493-injected eye. Top shows raster plots of individual RGC activities, bottom shows average firing rate from all cells.
(B) The average of 9 light flashes, showing reduced spontaneous activity and robust light response in the BMS 493-injected eye.
(C) Responses from 5 mice, comparing the light-elicited change in firing in the vehicle-injected (1%DMSO in PBS) and BMS 493-injected eye. Data is shown as mean ± SEM, *p<0.05, Paired t-test.
(D) Intensity-response curves from the retinas of vehicle-injected and BMS 493-injected eyes. Solid line is a basis-spline fit to the data. Data are represented as the mean ratio of firing rate in the light/dark ± SEM. For full dataset, see Table S1.

