
Figure 3.
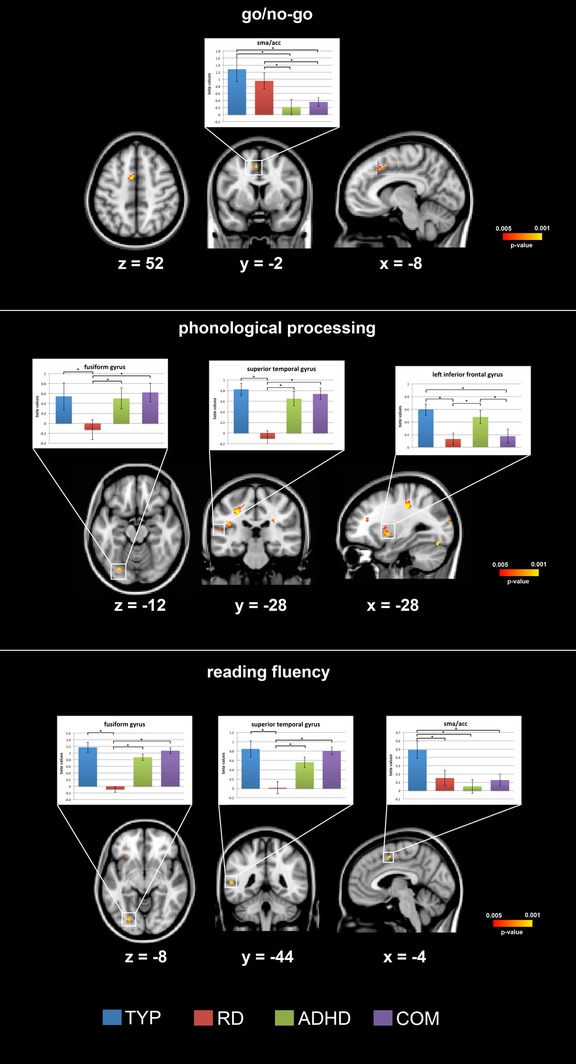
The results for the whole‐brain one‐way ANOVA for each fMRI task, with p values below p < 0.005 uncorrected for multiple comparisons, are plotted. Representative bar plots demonstrate the mean and standard error of the beta values for each group in key regions of the reading and executive function networks. MNI coordinates are presented for the respective brain slice. The complete list of results can be found in Figure 4 and Tables 3, 4, 5 [Color figure can be viewed at http://wileyonlinelibrary.com]