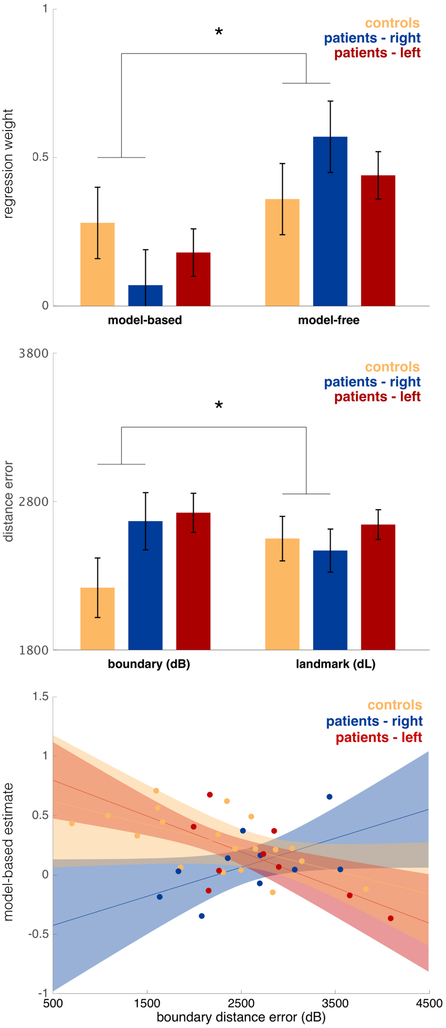
Figure 7. Top: Model-free and model-based regression weights controls, right and left lateralized ATL patients.
Estimated with a logistic mixed-effects regression, controlling for IQ and age. Error bars indicate standard error. The difference in model-free vs. model-based was significantly different between the control and right patient group (z=2.295 p=0.022). Middle: Boundary (dB) and response (dL) distance error (arbitrary units) for controls and patients with right and left lateralized ATL. Estimated with a linear mixed-effects regression, controlling for IQ and age. Error bars indicate standard error. There was a significant difference between dB and dL when comparing the control and right patient group (F1,92.22=4.463 p=0.034). Bottom: Relationship between model-based planning and boundary distance error (arbitrary unit) for controls and patients with right and left lateralized ATL. Estimated with a logistic mixed-effects regression, controlling for IQ. Error bars indicate 80% confidence intervals. Individual place memory performance is reflected by mean boundary distance error (dB) from the spatial task. Dots indicate estimates for individual participants, calculated from the mixed-effects logistic regression. The association differed significantly between the control and right patient group (z=2.5497, p=0.011).

