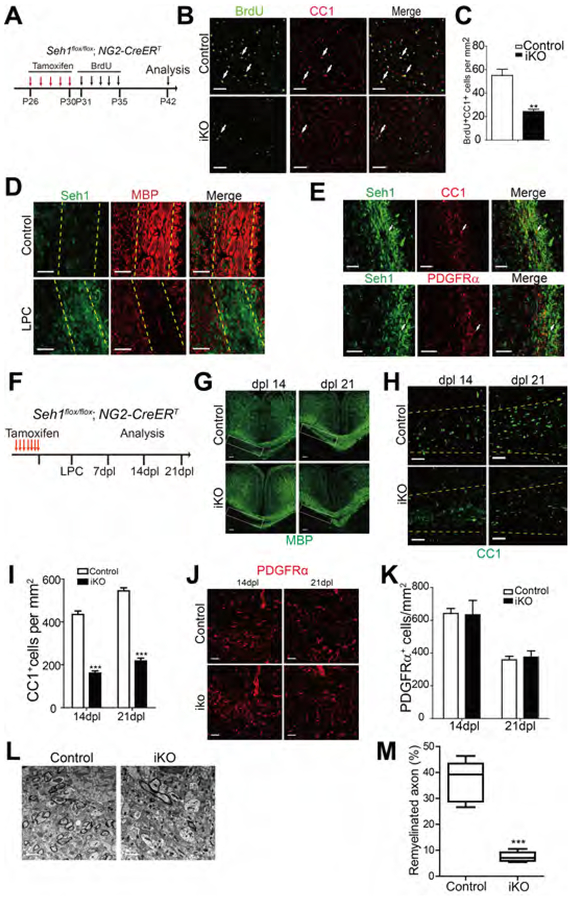
Figure 3. Seh1 Is Critical for Adult Myelinogenesis and OL Remyelination after Demyelination.
(A) Diagram showing tamoxifen administration from P26 to P30 and BrdU labeling from P31 to P35 in the inducible mouse models.
(B) Immunostaining of BrdU and CC1 on the corpus callosum of control and Seh1 OPC-iKO mice at P42 after tamoxifen and BrdU injection. Arrows indicate BrdU+/CC1+ cells. Scale bars=50 μm.
(C) Quantification of BrdU+/CC1+ cells per mm2 in the corpus callosum of tamoxifen-treated control and Seh1 OPC-iKO mice at P42 (n= 3 for control and n=3 for Seh1-iKO mice. **p=0.0054).
(D) Immunostaining of Seh1 and MBP at Dpl 7 in the corpus callosum from non-lesion control and mice with LPC lesion. Yellow dashed lines indicate corpus callosum. Scale bars=50 μm.
(E) Immunostaining of Seh1, CC1, and PDGFRα at Dpl 14 in the LPC lesions of the corpus callosum. Arrows indicate Seh1+/CC1+ (top) and Seh1+/PDGFRα+ (bottom) cells. Scale bars=50 μm.
(F) Diagram showing tamoxifen administration and LPC injection schedule.
(G, H and J) Immunostaining of MBP (G), CC1 (H) and PDGFRα (J) in the corpus callosum lesions of control and Seh1 OPC-iKO mice at Dpl 14 and 21. Scale bars =100 μm in (G) and 50 μm in (H) and (J).
(I and K) Quantification of CC1+ oligodendrocytes (I) and PDGFRα+ OPCs (K) in LPC-induced lesions at Dpl 14 and 21 (I: n= 3 for control and n=3 for Seh1 OPC-iKO mice at 14dpl, ***p=0.0001; n= 3 for control and n=3 for Seh1 OPC-iKO mice at 21 dpl, ***p<0.0001; K: n= 3 for control and n=3 for Seh1 OPC-iKO mice at 14dpl, p=0.9330; n= 3 for control and n=3 for Seh1 OPC-iKO mice at 21 dpl, p=0.7247).
(L) Electron microscopy of LPC lesions from control and Seh1 OPC-iKO corpus callosum at Dpl 14. Scale bars=2 μm
(M) Quantification of remyelinated axons in LPC-induced lesion of control and Seh1 OPC-iKO corpus callosum at Dpl 14. (n= 3 for control and n=3 for Seh1 OPC-iKO mice at 14dpl, ***p<0.0001)
Data are represented as mean ± SEM; **p<0.01, ***p<0.001, two-tailed unpaired Student’s t test.
See also Figure S3.

