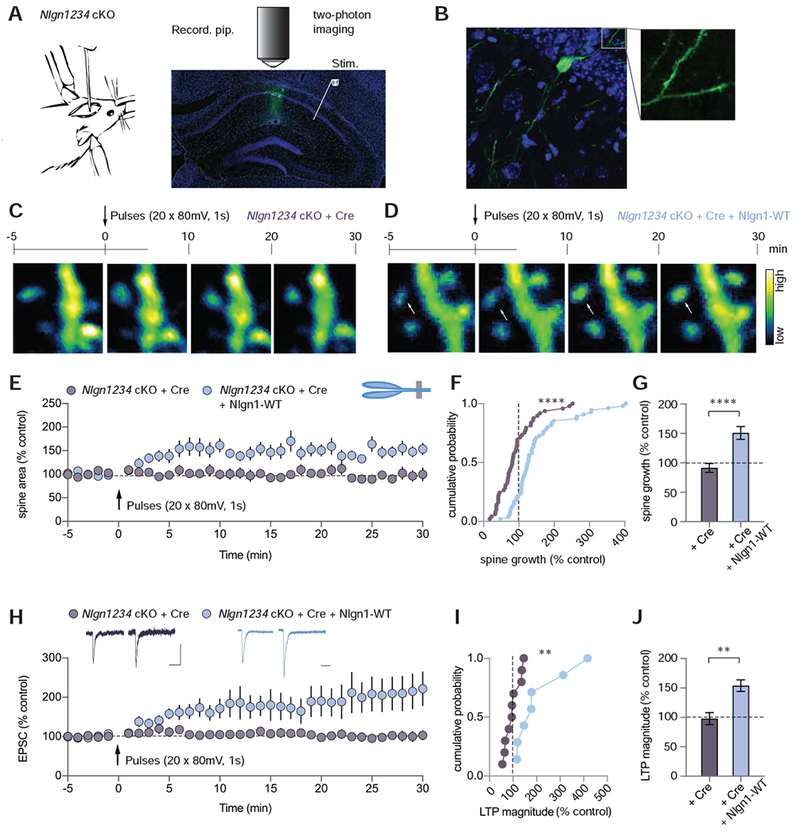
Figure 5. Neuroligin1234 Deletion Impairs LTP-induced Growth of Dendritic Spines.

(A) Illustration of mouse lentiviral stereotactic injection into the CA1 region of the hippocampus (left). Annotated confocal image of hippocampal slice (right) from a mouse showing lentiviral Cre-EGFP + AAV-DJ-CMV-DIO-EGFP (cytoplasmic) infection of CA1 pyramidal neurons. The recording pipette (Recording pip.), sealed onto a CA1 pyramidal neuron, was used to elicit LTP. While recording, a dendrite segment of the patched cell was imaged with a two-photon microscope at a frequency of 96 frames per minute. DAPI (blue), GFP (green). Scale bar: 500 μm.
(B) Confocal image of EGFP-positive cell in slice imaged with 60X objective. DAPI (blue), GFP (green). Scale bar: 10 μm.
(C, D) The time course of experiments with representative two-photon images of dendritic segments from Nlgn1234 cKO slices infected with AAV-DJ-CMV-DIO-EGFP (cytoplasmic) and (C) lentiviral Cre-EGFP or (D) Cre-EGFP + Nlgn1-WT. White arrow shows example spine that grew relative to baseline. Bar on right displays the color coding reflecting the degree of fluorescence intensity. Scale bar: 2.5 μm
(E) Summary time course of spine growth during VGCC-dependent LTP in Nlgn1234 cKO mice expressing Cre-EGFP or Cre-EGFP + Nlgn1-WT.
(F) Cumulative frequency plot of changes in spine area for all imaged spines in the two conditions.
(G) Quantification of spine growth magnitude (mean ± SEM; numbers = spines/cells).
(H) Summary time course of EPSCs following induction of VGCC-dependent LTP. Insets show sample traces pre- and post-pulses (Scale bars: 50 pA, 50 ms).
(I) Cumulative frequency plot of LTP magnitude for individual cells.
(J) Quantification of LTP magnitude (mean ± SEM; numbers = cells/animals). Mann Whitney test,**p<0.01, ****p<0.0001.
