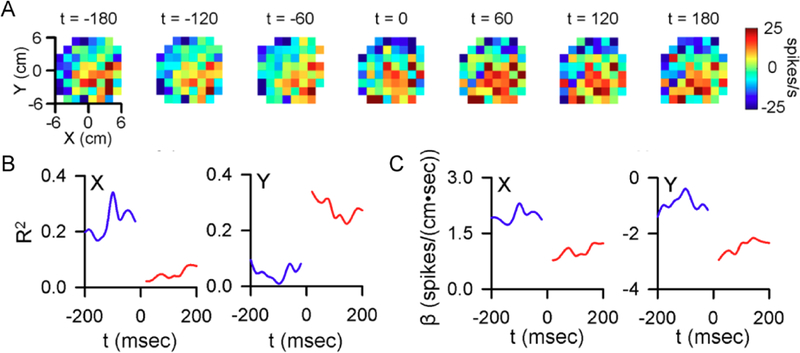
Figure 6.

Climbing fiber input changes the representations encoded in the SS discharge. A) Firing maps illustrating example SS modulation with position relative to CS occurrence (t = 0). B) Pre- and post-CS encoding strength of X and Y. C) Pre-and post-CS SS firing sensitivity for this cell to X (left) and Y (right). B-C) Blue traces denote pre-CS, red traces denote post-CS. A- C adapted from (Streng and others 2017a).
