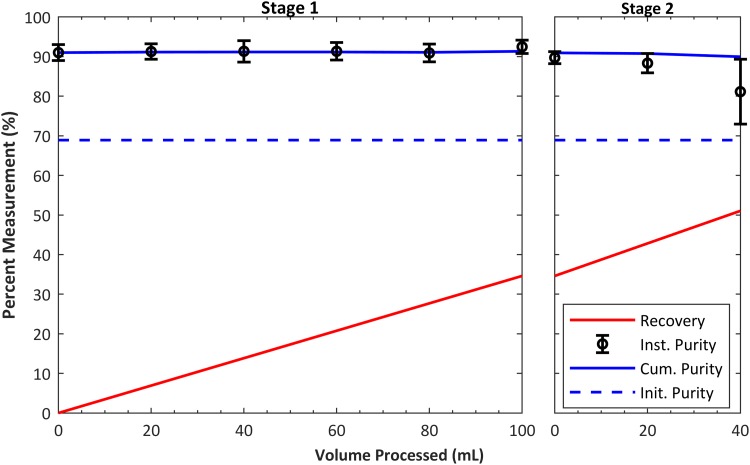
FIG. 10.
Results of continuous purification of 100 ml solution of leukapheresis product at 1 ml/min. The plot shows average cumulative purity (blue solid line) and recovery (red line) of lymphocytes from 3 experiments. Left graph shows results from stage 1 experiment, while right graph shows results including the stage 2 experiment. The stage 2 input sample was center (waste) output from stage 1 without any additional dilutions. Including both RBCs and WBCs, the device processed over cells per run.

