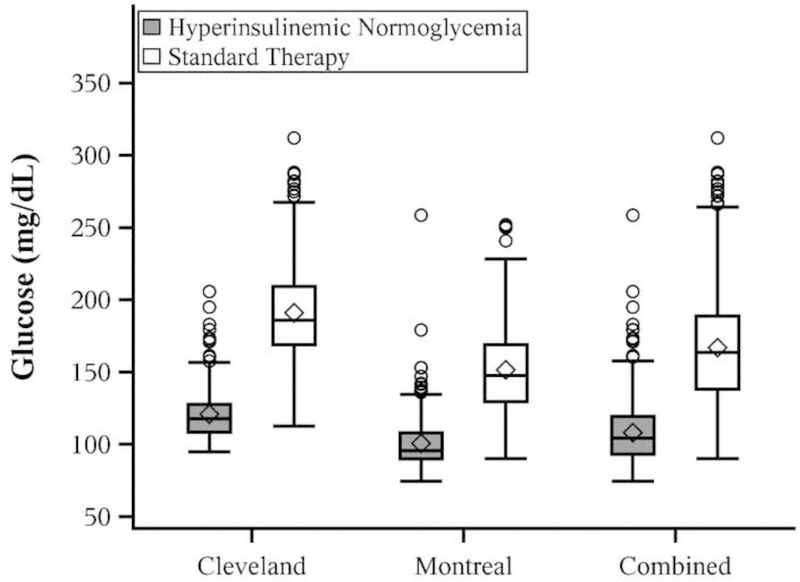
Figure 2.
Boxplots comparing randomized groups on time weighted intraoperative glucose concentrations overall and within site. All = combined sites; HN = hyperinsulinemic normoglycemia. Box shows the interquartile range; horizontal line marks the median; whiskers extend to high and low values within 1.5 interquartile range of the box; circles are values beyond 1.5 interquartile range of the box; diamond shows the mean.

