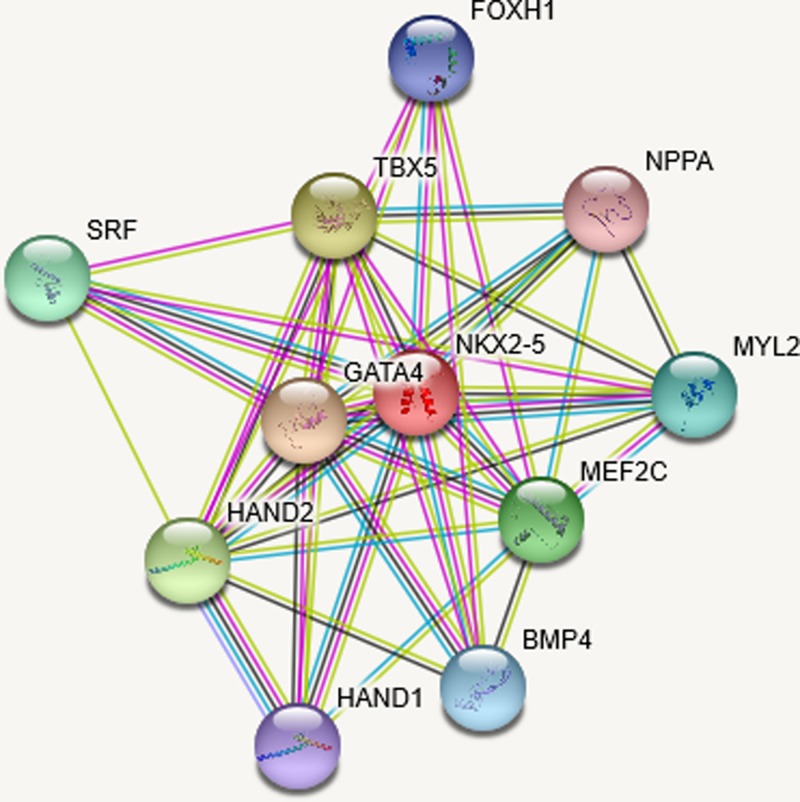
Figure 1. Splice isoforms or post-translational modifications are collapsed, while each node represents all the proteins produced by a single, protein-coding gene locus.
The edges represent protein–protein interactions with different color according to the interaction type. A red line indicates the presence of fusion evidence, green line a neighborhood evidence, blue line a cooccurrence evidence, purple line an experimental evidence, yellow line a textmining evidence, light blue line a database evidence, and black line a coexpression evidence.

