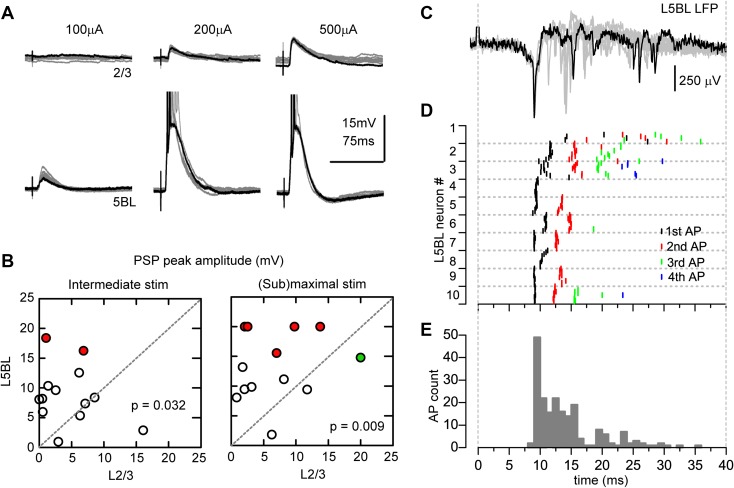
Fig. 1.
Larger gain of the synaptic response of L5BL vs L2/3 pyramidal neurons. a Postsynaptic potentials evoked in a L2/3 (upper panel) and a L5BL pyramidal neuron (lower panel) recorded sequentially in the same slice in response to electrical stimulation of the contralateral cortex. 10 superimposed responses are shown for each neuron at each stimulus intensity (100–500 µA); one trace is highlighted in black. Action potentials in the L5BL pyramidal neuron are truncated. b PSP peak amplitude in a sample of L2/3 and L5BL pyramidal neurons sequentially recorded (n = 13 pairs) in response to intermediate (left; stimulus intensity: 221 ± 34 µA) and near-maximal (right; stimulus intensity: 485 ± 28 µA) stimulus intensities. Each symbol represents the average PSP amplitude of ten consecutive responses. Red circles represent L5BL neurons in which firing was evoked at least in 5/10 responses; green symbol shows the L2/3 neuron that fired in response to near-maximal stimulus. In neurons in which firing was evoked by the stimulus, a value of 20 mV was applied for statistical comparison and graphical representation. The average amplitudes of the PSPs were 4.5 ± 1.2 mV (L2/3 neurons, intermediate stimuli), 6.6 ± 1.5 (L2/3 neurons, near-maximal stimuli), 8.6 ± 1.4 (L5BL neurons, intermediate stimuli) and 13.5 ± 5.6 (L5BL neurons, near-maximal stimuli). The difference in peak amplitude was statistically significant (intermediate stimuli: p = 0.032; near-maximal stimuli: p = 0.009). c Extracellular recording of the local field potential evoked in layer 5B in response to contralateral stimulation. Notice the abundant presence of fast, negative deflections, presumably as a result of the firing activity of layer 5 neurons. 10 superimposed responses are shown, one highlighted in black. d Latency of the action potentials in the subsample of L5BL pyramidal neurons recruited by submaximal stimulation (n = 204 spikes from 10 L5BL pyramidal neurons, 6 slices from 6 mice, stimulus intensity 450 ± 25 µA). For each neuron, action potential latency is represented for each one of the ten consecutive responses. e Frequency histogram of the latency of the action potential shown in d. Notice that in agreement with the extracellular recording (G), there is a peak before 10 ms and a long tail that expands until 40 ms after the stimulus. Temporal scales in c–e are the same

