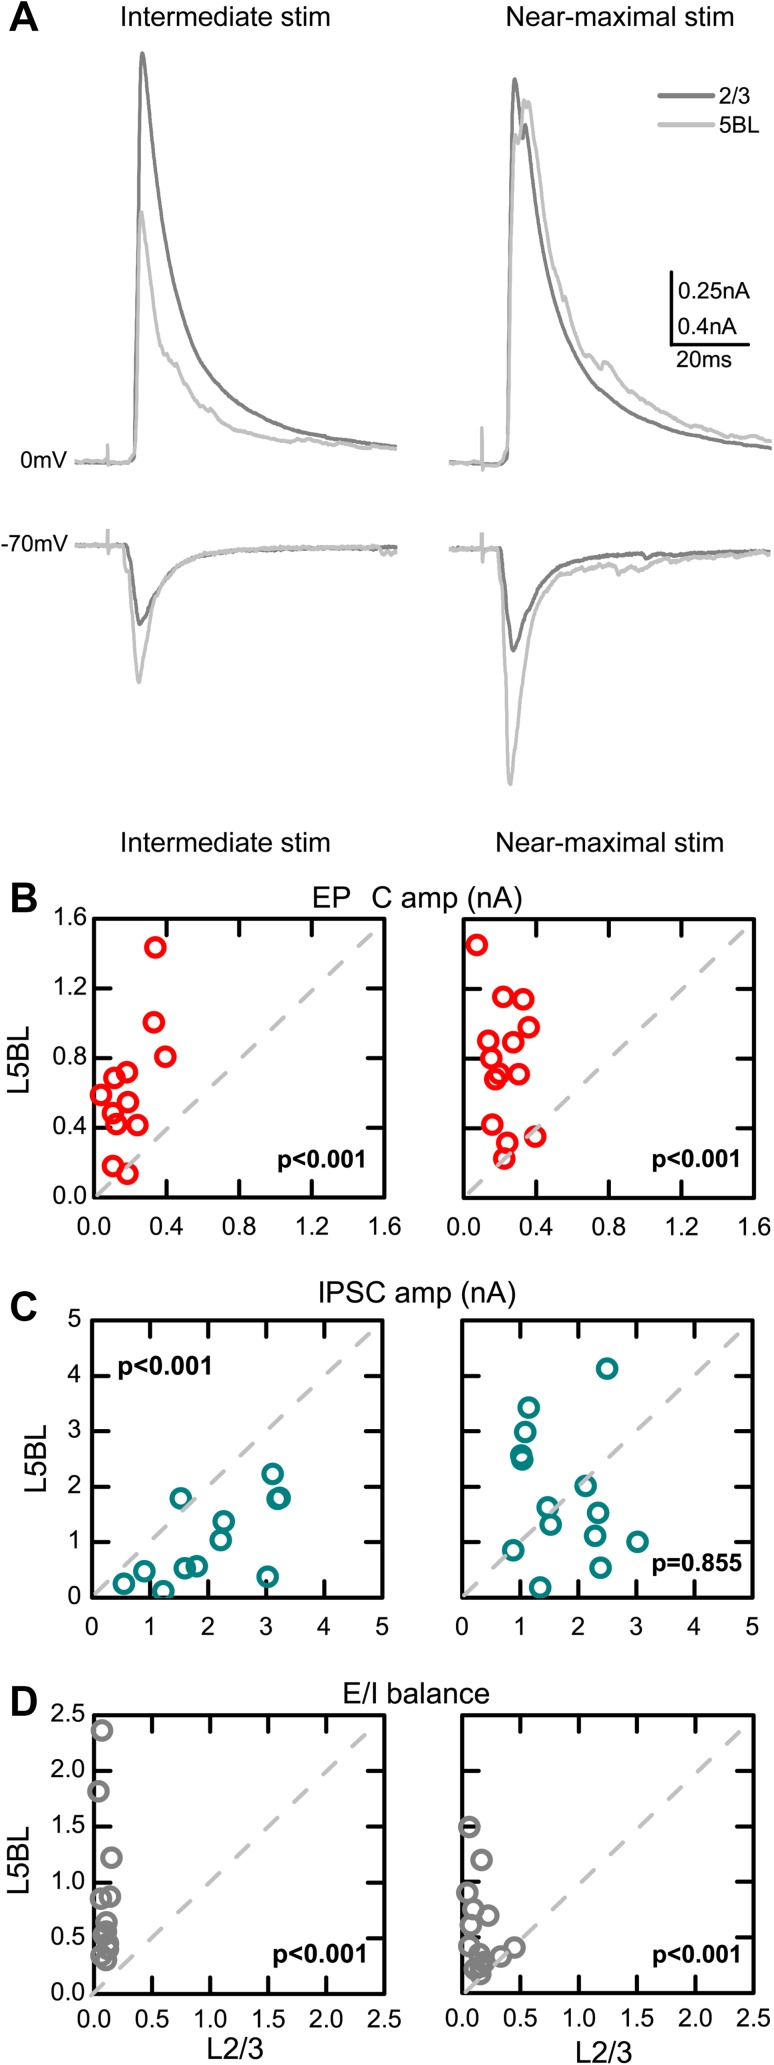
Fig. 3.
Larger excitation/inhibition balance in the cortical response of L5BL vs L2/3 pyramidal neurons. a Example of the compound EPSCs and IPSCs evoked in a L2/3 (dark gray) and a L5BL pyramidal neuron (light gray). Traces represent the average of ten successive responses to a 200 µA (left panel) and 500 µA stimulus pulse (right panel). Notice that the compound EPSC is larger in the L5BL pyramidal neuron at both intensities tested, while the compound IPSC is larger in the L2/3 pyramidal neuron in response to 200 but not to 500 µA stimulation. b–d Peak amplitude of the compound EPSCs (b), compound IPSCs (b), and excitation to inhibition balance (d, E/I ratio as cEPSC/cIPSC amplitude) for a paired sample of L2/3 and L5BL pyramidal neurons. Each dot represents the values for the responses recorded in both neurons from a pair. Data in b–d were obtained in response to intermediate stimulus intensities (left panels, range 150–400 µA; mean ± SEM: 233 ± 20 µA, n = 12 pairs, six slices from six mice) and in response to near-maximal stimulus intensities (right panels, range 500–800 µA; mean ± SEM: 571 ± 51 µA, n = 14 pairs, eight slices from eight mice). In nine pairs, both intensities were tested. Notice that the E/I balance is more favorable to excitation in L5BL pyramidal neurons at both intensities tested

