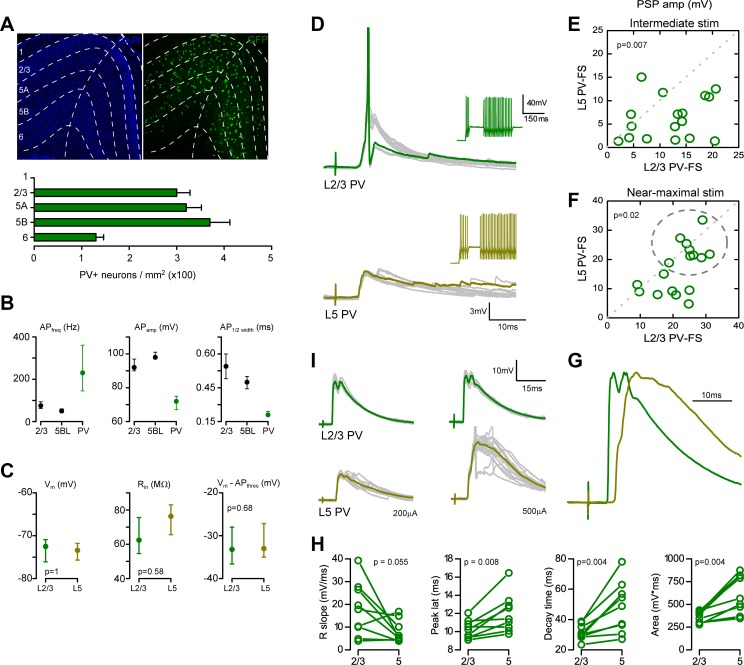
Fig. 5.
PV-FS interneurons in layer 5 are less excitable than PV-FS cells in layer 2/3. a Quantification of PV + somas across layers in the retrosplenial agranular cortex by immunostaining with an anti-PV antibody in 40-µm slices (n = 6 slices from 3 brains; an example is shown in the upper panel in the right). Laminar boundaries were established according to DAPI staining (left panel). Notice that PV + soma density was similar across layers 2/3, 5A and 5B. b EGFP + neurons from Pvalb-Cre;RCE mice slices were clearly distinguishable from pyramidal cells according to their firing frequency, AP amplitude and AP half width in response to depolarizing somatic current steps (575 pA for firing frequency quantification). c No difference were detected in the resting potential, input resistance and resting to action potential threshold difference in a paired sample of L2/3 and L5 PV-FS interneurons (n = 17 pairs sequentially recorded, 11 slices from 10 mice). Within this sample, the soma position in the cortical column was (in µm from pia, median and range): L2/3 PV-FS: 210, 150–340 µm; L5 PV-FS: 510, 400–650 µm. d Example of the postsynaptic potentials evoked in one of such pairs (upper panel L2/3 PV-FS; lower panel L5 PV-FS interneuron; stimulus intensity 500 µA). 10 successive responses are shown, one highlighted in green. Notice that the layer 2/3 PV-FS interneuron, but not the one in layer 5, fires in response to the stimuli (AP truncated). The insets in the left show the firing pattern of both neurons in response to the intracellular injection of suprathreshold current steps. e, f PSP peak amplitude in the same sample of L2/3 and L5 PV-FS interneurons shown in panel c. Two stimulus intensities were employed in each pair (in µA, mean ± SEM): 165 ± 50 µA (e) and 483 ± 71 µA (f). Notice that PSP peak amplitude was larger in layer 2/3 PV-FS interneurons at both intensities tested. Each dot represents the peak amplitude of the PSPs recorded for both neurons in a pair. g Example of a L2/3 vs L5 PV-FS pair in which the AP threshold was reached in some trials in the deeper neuron (AP truncated). Notice that for the superficial PV-FS cell, the responses at both intensities tested are similar, while for the deep PV-FS cell, the response at 200 µA is smaller, but increases with the 500 µA stimulus. h Normalized subthreshold PSPs evoked in the pair of PV-FS cells shown in d (stimulus intensity 500 µA). Notice the different time course of both responses. i. PSP rise slope (20–80%), peak latency, decay time (from peak to 10% of PSP amplitude) and area for the nine pairs that appear within the dotted line in f

