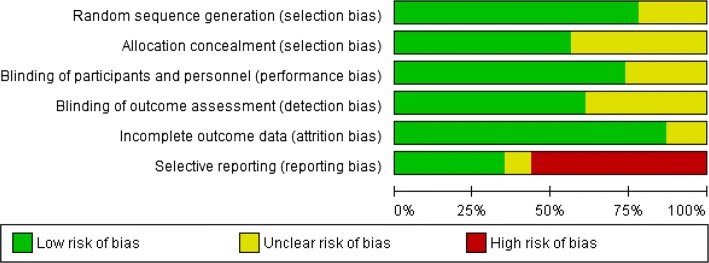
Fig. 3.
Risk of bias graph: review authors’ judgements about each risk of bias item presented as percentages across all studies included in the qualitative synthesis. Note: This figure does not include information on risk of bias for the two diclofenac NCT studies, as explained in Sect. 3; thus, the summaries made here are based on data from 23 studies

