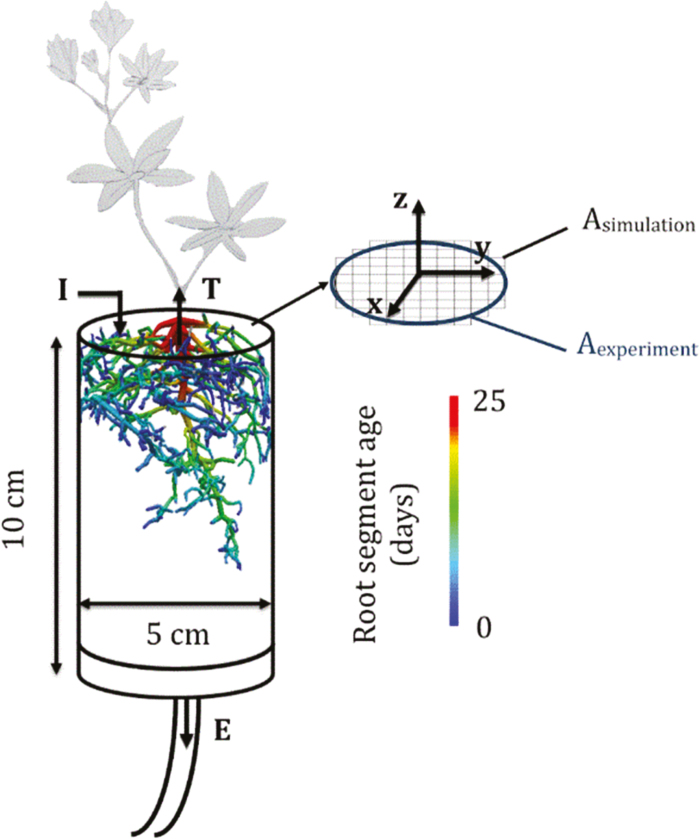
Fig. 1.
Diagram of the experimental set-up. The experimental column and the reconstructed final root architecture at 25 d after sowing are shown. The fluxes considered in the modeling are irrigation (I), transpiration (T), and effluent (E). The experimental and simulated column cross-sections are also shown.

