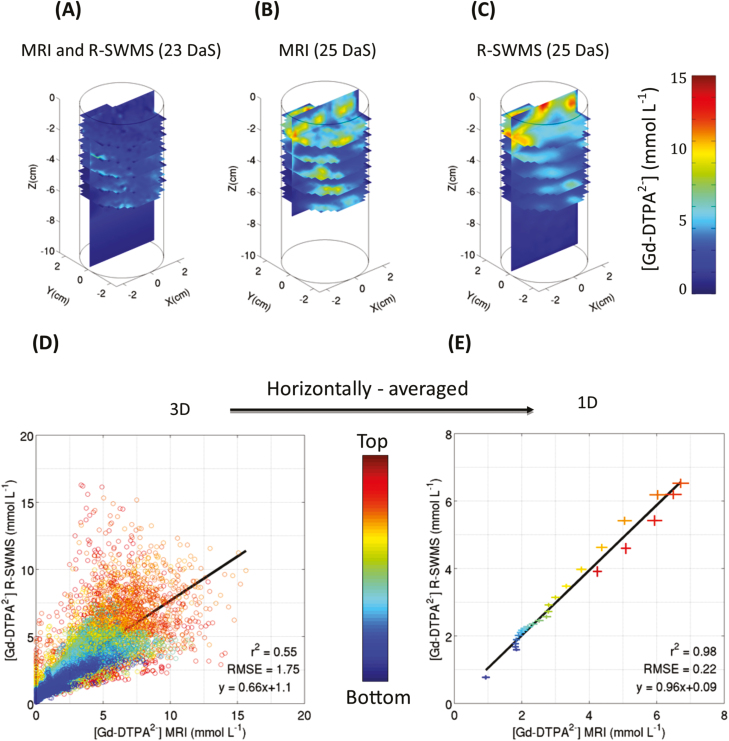
Fig. 2.
(A) 3D concentration distribution of the Gd-DTPA2− tracer at 23 d after sowing (DAS), imaged by MRI and used as the initial condition for the model. (B) Tracer concentration distribution measured by MRI at 25 DAS. (C) Tracer concentration distribution modeled by R-SWMS at 25 DAS. (D) Correlation between the final (25 DAS) experimental (MRI) and simulated (R-SWMS) 3D tracer concentration distributions. (E) Correlation between the final (25 DAS) experimental (MRI) and simulated (R-SWMS) horizontally-averaged concentration distributions, with horizontal and vertical error bars respectively representing the observed and simulated SDs at each depth.

