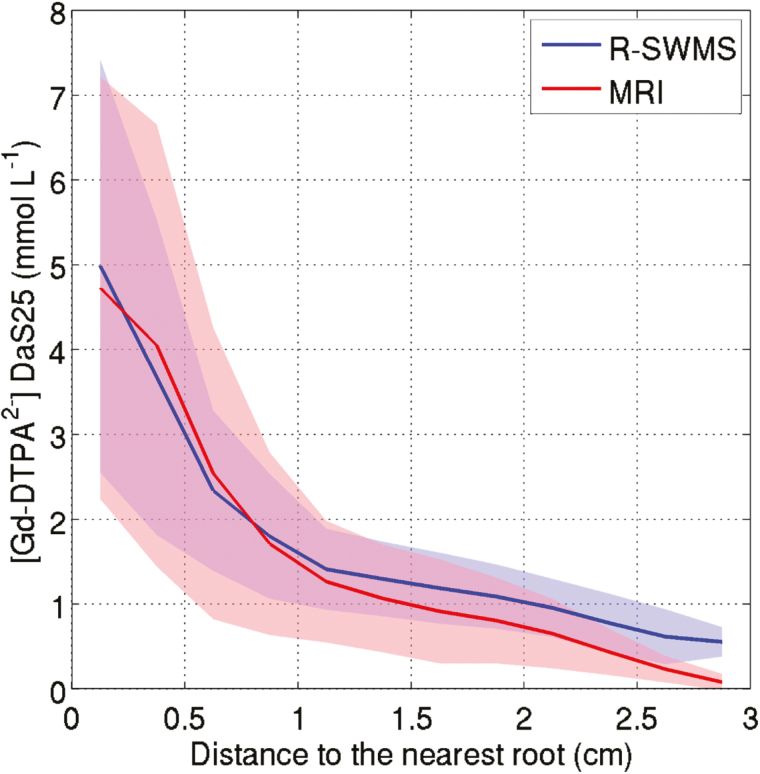
Fig. 3.
Concentration of Gd-DTPA2− in a voxel versus distance to the nearest lateral root at 25 d after sowing (DAS) as determined experimentally by MRI or simulated using R-SWMS. The voxels were binned with an interval of 0.25 cm. The lines represent the mean concentrations and the shaded areas cover ±1 SD.

