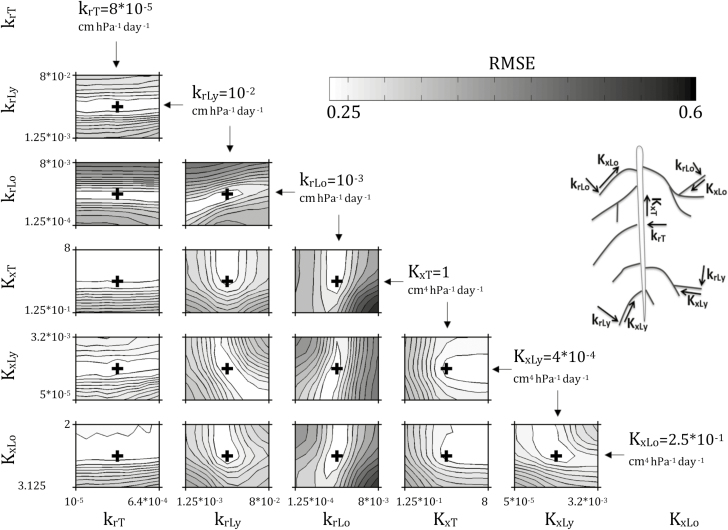
Fig. 4.
RMSE (mmol l−1) between observed and simulated Gd-DTPA2− concentrations at 25 d after sowing (DAS) as a function of different values of the root hydraulic properties considered in the simulations (see Table 1). The lower the RMSE (i.e. lighter shading), the closer the simulation results are to the experimental ones. The black crosses correspond to the lowest RMSE, and to the optimal parameter sets. The corresponding optimal parameters are given for each plot. Kx and kr are in cm4 hPa−1 d−1 and cm hPa−1 d−1, respectively. The subscripts T, Ly, and Lo refer to taproot, young laterals, and old laterals, respectively.

