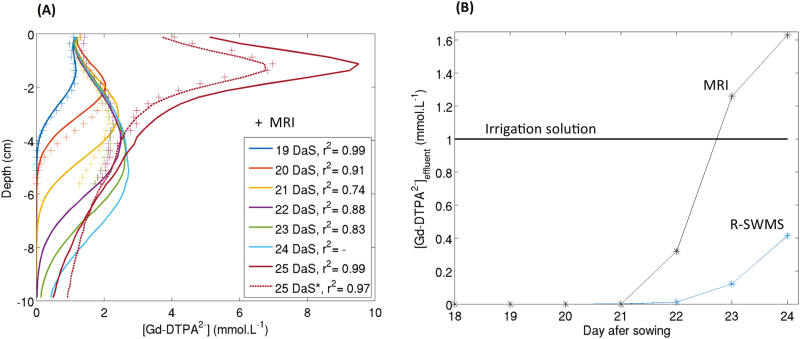
Fig. 6.
(A): Modeled and measured Gd-DTPA2− concentration profiles. The concentrations were either measured using MRI (crosses) or simulated using the R-SWMS model (lines). No MRI data were available for 24 d after sowing (DAS); the solid lines result from simulating the whole experimental period (18–25 DAS) and the dotted line (25 DAS*) results from simulating 23–25 DAS only. (B) Modeled and measured concentrations of Gd-DTPA2– in the effluent (‘breakthrough curves’). The irrigation solution had a constant concentration over the entire experiment.

