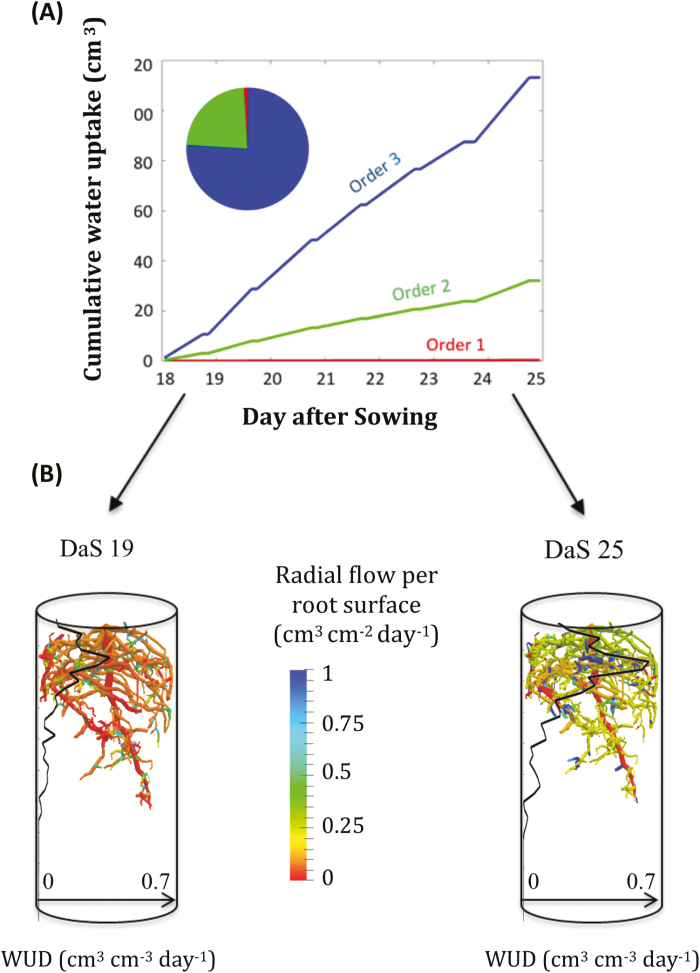
Fig. 7.
(A) Cumulative water uptake volume by different root orders during the course of the experiment, and pie-chart of the contributions by the different root orders at 25 d after sowing (DAS). (B) Radial root flow distributions over a day during the first (left, 19 DAS) and the last (right, 25 DAS) day of the experiment. The water uptake density (WUD) 1D profiles are also given (black lines).

