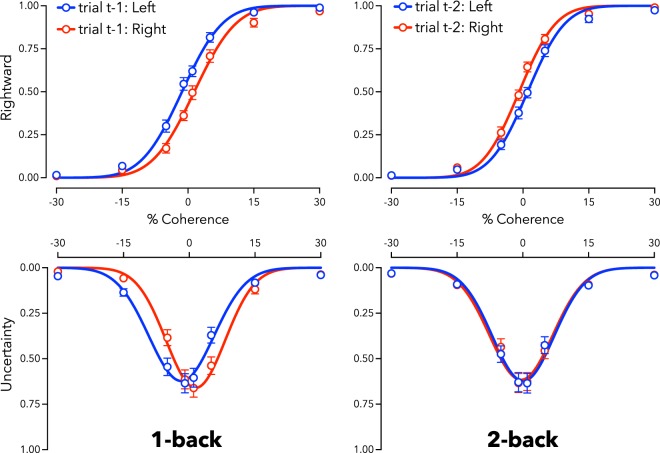
Figure 6.
Proportion of rightward motion reported (top row) and low-confidence (uncertainty, bottom row) as a function of dot coherence (percent) and direction (negative values left, positive right). Data are divided according to the physical direction of the last test (Left panel: t-1 data), and according to the physical direction of the test two trials ago (Right panel: t-2 data). Blue data indicate that the prior trial was moving left, red that the prior trial was moving right. Depicted data are averaged across participants, but statistical tests were based on individual fits. N = 22; Error bars depict ± 1 SEM.

